
Ferro Vecchio
vecchio brontolone
- Registrato
- 7/9/05
- Messaggi
- 51.734
- Punti reazioni
- 911
Prima finite il 107 !!
un po' di storico....
106 - 105 - 104 - 103 - 102 - 101 - 100
99 - 98 - 97 - 96 - 95 - 93 - 92 - 91 - 90
89 - 88 - 87 - 86 - 85 - 84 - 83 - 82 - 81 - 80
79 - 78 - 77 - 76 - 75 - 74 - 73 - 72 - 71 - 70
69 - 68 - 67 - 66 - 65 - 64 - 63 - 62 - 61 - 60
59 - 58 - 57 - 56 - 55 - 54 - 53 - 52 - 51 - 50
49 - 48 - 47 - 46 - 45 - 44 - 43 - 42 - 41 - 40
39 - 38 - 37 - 36 - 35 - 34 - 33 - 32 - 31 - 30
29 - 28 - 27 - 26 - 25 - 24 - 23 - 22 - 21 - 20
19 - 18 - 17 - 16 - 15 - 14 - 13 - 12 - 11 - 10
9 - 8 - 7 - 6 - 5 - 4 - 3 - 2 - 1
il ts adx/adm
l’adx o average directional index
è un ottimo indicatore di medio periodo però
indica solo la forza del trend e non la sua direzione.
Il valore dell’adx può essere compreso tra 0 e 100. Tipicamente un trend caratterizzato da un adx al di sotto del 20 è considerato debole, mentre sopra 25 è da considerarsi forte.
Molto più utili gli indicatori +di (positive directional indicator) ed il -di (negative directional indicator), considerando la loro media a 14 giorni: +di14 in verde e -di14 in rosso.
I loro incroci deteminano la la direzione del trend.
+di14 > -di14+flatzone = long
+di14 < -di14-flatzone = short
flat nella fascia -flatzone+flatzone dell'incrocio
la flatzone era -10% +10% nelle vecchie versioni , ora è calcolata anche essa in base a dei backtest periodici
l'adm o average daily movement è un indicatore intraday basato sulla volatilità
vengono dati ogni giorno 2 entry (long o short) e 3 take profit (long e short)
operativamente:
si entra long/short se alla chiusura oraria (alle 10, alle 11, ecc) il valore dell’indice è superiore/inferiore all’entry long/short giornaliero
poi
se non arriva il tp xx entro chiusura
se siamo in trend (vedi adx) si va in over e il giorno dopo si chiude se entra il segnale di reverse
se siamo controtrend (adx contrario) si chiude in chiusura mercato
per esempio…
al segnale io entro long con 3 posizioni (3 contratti, ecc…)
la 1° pos va in take profit sul tp1 (alla battuta)
la 2° sul tp2 (alla battuta) una volta fatto il tp1 (candela oraria) si alza lo stop loss sull’entry
la 3° sul tp3 (alla battuta) una volta fatto il tp2 (candela oraria) si alza lo stop loss sul tp1
- se adx è flat o long, se non ha raggiunto uno dei target si porta la posizione in over…..
Il giorno dopo al raggiungimento del tp1 si vendono tutte le posizioni e si aspettano i segnali nuovi, se invece non arriva l’ex-tp1 ma entra l’entry contraria si chiude tutto e si reversa.
- se adx è short meglio chiuderla in giornata
varianti intraday
i livelli sono da considerare come resistenze/supporti
una volta superata una resistenza diventa supporto, e viceversa….
Per esempio il 21/04/2015
ha fatto
1 – entry long
2 – entry short (stop loss & reverse)
3 – tp1 short
4 – ex-entry short (nuovo entry long)
5 – ex-entry long (nuovo tp1 long)
calcolo dei livelli intraday
adm è la media su n-giorni della volatilità giornaliera (max-min) , la media a n giorni…
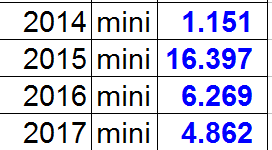
io ora lo calcolo periodicamente in base a dei backtest e lo trovate in alto a sinistra nel grafico , nelle prime versioni del ts usavo il valore di 30 giorni, che è abbastanza valido
,altri usano altri valori..
I livelli di entrata vengono calcolati in questo modo
i livelli di entrata vengono calcolati in questo modo:
La teoria standard dice di usare un break-out level = 0.382 (price break) , io ultimamente lo sto calcolando ogni giorno in base alla volatilità
(chiusura giorno precedente + price break*adm ndays) ci dà l’entry long
(chiusura giorno precedente – price break*adm ndays) ci dà l’entry short
dayc = chiusura giorno precedente
c = prezzo corrente
entry long = c>((dayc)+((price break)*(adm ndays)));
entry short = c<((dayc)-((price break*(adm ndays)));
ho notato che però quando aumenta la volatilità il price break posto a 0,382 genera diversi falsi segnali
pertanto dalla versione 3.0 sto sperimentando questa formula…
price break=(0,382+0,382*((adm 10 days-adm ndays)/adm ndays))
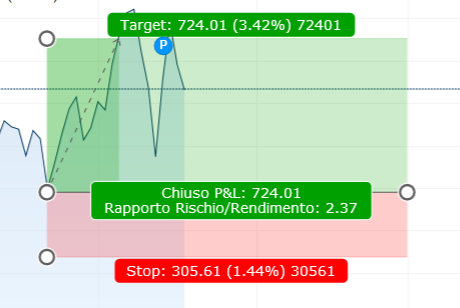
i target invece vengono così calcolati….
Target 1 long = (0.45*adm)+entry long;
target 2 long = (0.95*adm)+entry long;
target 3 long = (1.95*adm)+entry long;
target 1 short = entry short-(0.45*adm);
target 2 short = entry short-(0.95*adm);
target 3 short = entry short-(1.95*adm);
-----------------------------------------------------------------------------------
probabilità dei vari tp

-----------------------------------------------------------------------------------
implementazioni su piattaforme standard:
adm v. 2. 0 per amibroker by murali krishna
http://www.wisestocktrader.com/indicators/4059-ultimate-volatility-trading-system-v-2.txt
adm per visualtrader by strong
Codice:{****************************************************************************** * adm by strong. * * versione 1 fix 1 del 18/04/2014 * * filtro ingressi attivo * ******************************************************************************} var: Newday(false), // cambio giorno numday(0), // storico giorni per calcolo adm lastrange,lastclose,historyrange,historyclose, // valori end of day num(0),den(0),adm(0),storico_adm(30), // adm targetlong(0),targetshort(0), // target x uscita stoplosslong(0),stoplossshort(0), // stoploss flaglong(false),flagshort(false), // singola operazione giornaliera buf, // temporanea zonaplotting; // // ************************ calcolo indicatore adm ***************************** // newday=getvalues (days, 1, buf,buf,buf,buf); if newday then // flag per gestire una operazione long e short al giorno flaglong=true; flagshort=true; lastrange=eod.r[1]; lastclose=eod.c[1]; num = num + lastrange*lastclose; den = den + lastclose; // gestione del numero di giorni per il calcolo dell'indicatore if numday >= storico_adm then historyrange=eod.r[storico_adm]; historyclose=eod.c[storico_adm]; num = num - historyrange*historyclose; den = den - historyclose; endif; // calcolo adm adm = num/den; inc(numday); endif; // // ************************ long *********************************************** // if lastbar = false and adm > 0 and flaglong and positionlong = false then // filtro sugli ingressi // if (c>h[1] or b[1]) and w and c > lastclose+ (0.382*adm) then if (c > lastclose + (0.5*adm)) then // if c > c[1]+ (0.382*adm) then colorbar(green); // cancelexitlong("target 0.5"); enterlong(nextbar,atopen); stoplosslong = 0.5 * adm; targetlong = adm * 0.5; flaglong = false; endif; endif; section_exitlong: // stoploss dinamico //exitlong(nextbar,positionvaluethisbar + targetlong , limit, 3 , "target 0.5"); // stoploss statico // if c < positionvaluethisbar - stoplosslong then //exitlong(nextbar,atopen); //endif; // uscita a fine giornata //if t = 1700 then // exitlong(bar,atclose); //endif; end_section // // ************************ short ********************************************** // if lastbar = false and adm > 0 and flagshort < 1 and positionshort = false then // filtro sugli ingressi // if (c < l[1] or w[1]) and b and c < lastclose - (0.382*adm) then if (c < lastclose - (0.5*adm)) then //if c < c[1] - (0.382*adm) then colorbar(red); //cancelexitshort("target 0.5"); entershort(nextbar,atopen); stoplossshort = 0.5 * adm; targetshort = adm * 0.5; flagshort=false; endif; endif; section_exitshort: //stoploss dinamico // exitshort(nextbar, positionvaluethisbar - targetshort, limit, 3, "target 0.5"); //stoploss statico //if c > positionvaluethisbar + stoplossshort then //exitshort(nextbar,atopen); //endif; // uscita a fine giornata //if t = 1700 then // exitshort(bar,atclose); //endif; end_section // // ************************ plotting ******************************************* // // disegna i valori di ingresso sul grafico principale plotchart(lastclose + adm*0.5 , 0, lime, solid, 1); plotchart(lastclose - adm*0.5 , 0, red, solid, 1); plotchart(lastclose + adm*0.5 + adm*0.45 , 0, green, dot, 1); plotchart(lastclose - adm*0.5 - adm*0.45 , 0, fuchsia, dot, 1); plotchart(lastclose + adm*0.5 + adm*0.95 , 0, green, dot, 1); plotchart(lastclose - adm*0.5 - adm*0.95 , 0, fuchsia, dot, 1); plotchart(lastclose + adm*0.5 + adm*1.95 , 0, green, dot, 1); plotchart(lastclose - adm*0.5 - adm*0.95 , 0, fuchsia, dot, 1); // crea area di plotting //zonaplotting = createviewport(200, true, true); // disegna i valori di calcolo sulla area di plotting (facoltativo) //plotchart(historyrange, zonaplotting, blue, solid, 1); //plotchart(lastrange, zonaplotting, red, solid, 1);
adm by strong. (modificato da webb ellis settembre 2015)
Codice:{*************************************** *************************************** * adm by strong. (modificato da webb ellis settembre 2015) * * versione 1 fix 1 del 18/04/2014 * * filtro ingressi attivo * **************************************** **************************************} var: Newday(false), // cambio giorno numday(0), numday10(0), // storico giorni per calcolo adm lastrange,lastclose,historyrange,history close,historyrange10,historyclose10, // valori end of day num(0),num10(0),den(0),den10(0),adm(0),s torico_adm(26), adm10(10),dif(0), pricebreak(0),pricebreak1(0), // adm targetlong(0),targetshort(0), // target x uscita stoplosslong(0),stoplossshort(0), // stoploss flaglong(false),flagshort(false), // singola operazione giornaliera buf, // temporanea zonaplotting; // // ************************ calcolo indicatore adm ***************************** // // aggiungo calcolo pricebreak newday=getvalues (days, 1, buf,buf,buf,buf); if newday then // flag per gestire una operazione long e short al giorno flaglong=true; flagshort=true; lastrange=eod.r[1]; lastclose=eod.c[1]; num = num + lastrange*lastclose; den = den + lastclose; num10 = num10 + lastrange*lastclose; den10 = den10 + lastclose; // gestione del numero di giorni per il calcolo dell'indicatore if numday >= storico_adm then historyrange=eod.r[storico_adm]; //adm 26 gg historyclose=eod.c[storico_adm]; num = num - historyrange*historyclose; den = den - historyclose; endif; // calcolo adm adm = num/den; inc(numday); // gestione del numero di giorni per il calcolo dell'indicatore da 10gg if numday10 >= adm10 then historyrange10=eod.r[adm10]; //adm 10gg historyclose10=eod.c[adm10]; num10 = num10 - historyrange10*historyclose10; den10 = den10 - historyclose10; endif; // calcolo adm adm10 = num10/den10; inc(numday10); pricebreak = 0.266+(0.266*(adm10-adm)/adm); //per long pricebreak1 = 0.382+(0.382*(adm10-adm)/adm); // per short endif; // // ************************ long **************************************** ******* // if lastbar = false and adm > 0 and flaglong and positionlong = false then // filtro sugli ingressi // if (c>h[1] or b[1]) and w and c > lastclose+ (0.382*adm) then //if (c > lastclose + (0.5*adm)) then // if c > c[1]+ (0.382*adm) then if (c > lastclose + (pricebreak*adm)) and (t>0959) // si entra dalle 10 in poi // and (c<lastclose + adm*pricebreak + adm*0.45) //minore del tp1 and c>c[1] then //in crescendo colorbar(green); // cancelexitlong("target 0.5"); enterlong(nextbar,atopen); stoplosslong = 0.5 * adm; targetlong = adm * 0.5; flaglong = false; endif; endif; section_exitlong: // stoploss dinamico //exitlong(nextbar,positionvaluethisbar + targetlong , limit, 3 , "target 0.5"); // stoploss statico // if c < positionvaluethisbar - stoplosslong then //exitlong(nextbar,atopen); //endif; // uscita a fine giornata //if t = 1700 then // exitlong(bar,atclose); // endif; // if c > (lastclose + adm*0.266 + adm*0.95) then //uscita al tp2 // exitlong(bar,atclose); // endif; end_section // // ************************ short **************************************** ****** // if lastbar = false and adm > 0 and flagshort < 1 and positionshort = false then // filtro sugli ingressi // if (c < l[1] or w[1]) and b and c < lastclose - (0.382*adm) then //if (c < lastclose - (0.5*adm)) then //if c < c[1] - (0.382*adm) then if (c < lastclose - (pricebreak1*adm)) and (t>0959) //oltre le 10 //and (c>(lastclose - adm*pricebreak1 - adm*0.45)) //maggiore del tp1 and c<c[1] then // in decrescita colorbar(red); //cancelexitshort("target 0.5"); entershort(nextbar,atopen); stoplossshort = 0.5 * adm; targetshort = adm * 0.5; flagshort=false; endif; endif; section_exitshort: //stoploss dinamico // exitshort(nextbar, positionvaluethisbar - targetshort, limit, 3, "target 0.5"); //stoploss statico //if c > positionvaluethisbar + stoplossshort then //exitshort(nextbar,atopen); //endif; // uscita a fine giornata //if t = 1700 then // exitshort(bar,atclose); //endif; // uscita per tp1 //if c < (lastclose - adm*0.266 - adm*0.95) then //uscita al tp2 // exitshort(bar,atclose); // endif; end_section // // ************************ plotting **************************************** *** // // disegna i valori di ingresso sul grafico principale plotchart(lastclose + adm*pricebreak, 0, lime, solid, 1); plotchart(lastclose - adm*pricebreak1, 0, red, solid, 1); plotchart(lastclose + adm*pricebreak + adm*0.45 , 0, green, dot, 1); plotchart(lastclose - adm*pricebreak1 - adm*0.45 , 0, fuchsia, dot, 1); plotchart(lastclose + adm*pricebreak + adm*0.95 , 0, green, dot, 1); plotchart(lastclose - adm*pricebreak1 - adm*0.95 , 0, fuchsia, dot, 1); plotchart(lastclose + adm*pricebreak + adm*1.95 , 0, green, dot, 1); plotchart(lastclose - adm*pricebreak1 - adm*1.95 , 0, fuchsia, dot, 1); // crea area di plotting //zonaplotting = createviewport(200, true, true); // disegna i valori di calcolo sulla area di plotting (facoltativo) //plotchart(historyrange, zonaplotting, blue, solid, 1); //plotchart(lastrange, zonaplotting, red, solid, 1);
adm per prorealtime by domedome61
Codice:admn=((high[26]-low[26])+(high[25]-low[25])+(high[24]-low[24])+(high[23]-low[23])+(high[22]-low[22])+(high[21]-low[21])+(high[20]-low[20])+(high[19]-low[19])+(high[18]-low[18])+(high[17]-low[17])+(high[16]-low[16])+(high[15]-low[15])+(high[14]-low[14])+(high[13]-low[13])+(high[12]-low[12])+(high[11]-low[11])+(high[10]-low[10])+(high[9]-low[9])+(high[8]-low[8])+(high[7]-low[7])+(high[6]-low[6])+(high[5]-low[5])+(high[4]-low[4])+(high[3]-low[3])+(high[2]-low[2])+(high[1]-low[1]))/26 el=(close[1]+(0.266*admn)) es=(close[1]-(0.266*admn)) el1=((0.45*admn)+el) el2=((0.95*admn)+el) el3=((1.95*admn)+el) es1=(es-(0.45*admn)) es2=(es-(0.95*admn)) es3=(es-(1.95*admn)) return el ,es,el1,el2,el3,es1,es2,es3
adm per prorealtime - timeframe orario - by domedome61
Codice:aaa=(dhigh(1)-dlow(1)) admn=(aaa[26]+(aaa)[25]+(aaa)[24]+(aaa)[23]+(aaa)[22]+(aaa)[21]+(aaa)[20]+(aaa)[19]+(aaa)[18]+(aaa)[17]+(aaa)[16]+(aaa)[15]+(aaa)[14]+(aaa)[13]+(aaa)[12]+(aaa)[11]+(aaa)[10]+(aaa)[9]+(aaa)[8]+(aaa)[7]+(aaa)[6]+(aaa)[5]+(aaa)[4]+(aaa)[3]+(aaa)[2]+(aaa)[1])/26 aab=(dclose(1)) el=(aab+(0.266*admn)) es=(aab-(0.266*admn)) el1=((0.45*admn)+el) el2=((0.95*admn)+el) el3=((1.95*admn)+el) es1=(es-(0.45*admn)) es2=(es-(0.95*admn)) es3=(es-(1.95*admn)) return el,es,el1,el2,el3,es1,es2,es3
adm per tradingview by aldebaran74
Codice:study("adm", overlay=true) gg = input(title="giorni", type=integer, defval=26, minval=1) bg = input(title="barre al giorno", type=integer, defval=9, minval=1) pb = input(title="price break", type=float, defval=0.266, minval=0.1) barre = gg*bg newbar = change(time("d")) != 0 ? 1 : 0 adm = (sum ((security(tickerid, "d", high[1])-security(tickerid, "d", low[1]))*newbar, barre)) / gg //non ho ancora trovato un metodo migiore per far capire che serve un valore per ogni giorno chiusuraieri = security(tickerid, "d", close[1]) compra = chiusuraieri + adm*pb vendi = chiusuraieri - adm*pb plot (compra, color=green, title="long", linewidth=2) plot (vendi, color=red, title="short", linewidth=2) plot (compra+(0.45*adm), color=green, title='tg1') plot (compra+(0.95*adm), color=green, title='tg2') plot (compra+(1.95*adm), color=green, title='tg3') plot (vendi-(0.45*adm), color=red, title='tg1') plot (vendi-(0.95*adm), color=red, title='tg2') plot (vendi-(1.95*adm), color=red, title='tg3')
adm per t3 webank by swing64
Codice://periodo = 26 ranges = 0 for i = 1 to periodo ranges = ranges + (dhigh(i)-dlow(i)) next adm=ranges/periodo entryshort = dclose(1) - adm*0.266 ts1 = entryshort-0.45*adm ts2 = entryshort-0.95*adm ts3 = entryshort-1.95*adm entrylong = dclose(1) + adm*0.266 tl1 = entrylong+0.45*adm tl2 = entrylong+0.95*adm tl3 = entrylong+1.95*adm return tl3 as "long3", tl2 as "long2", tl1 as "long1",entrylong as "entry long",entryshort as "entry short",ts1 as "short1",ts2 as "short2",ts3 as "short3"