- Registrato
- 21/10/08
- Messaggi
- 369
- Punti reazioni
- 10
Grandi prospettive...
Che dite??????
")
Che dite??????
Follow along with the video below to see how to install our site as a web app on your home screen.
Nota: This feature may not be available in some browsers.

Solo oggi ho scoperto questa ottima azienda. Al momento ho in portafoglio la D'Amico, ma metto anche la OSG in watch list
Ottima, sempre nel settore shipping (materie prime non petrolifere e container), la Euroseas (ESEA).
La crisi del settore e' un rischio per le aziende deboli. Per chi ha le casse piene di soldi e' una opportunita'
Posto alcuni numeri.
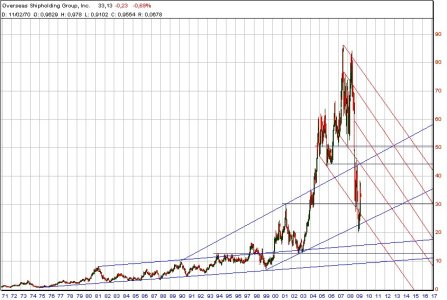
Prezzo e volumi (USD)
Prezzo 33.13
Max 12 mesi 87.79
Min 12 mesi 20.38
Data prezzo 05/06/2009
Volume medio (ultimi 10gg) 1.07
Capitalizzazione (mln) 889.93
Dati per azione (USD)
EPS (Utili per azione) 10.28
EPS (Utili per azione) normalizzati 13.48
Fatturato per azione 54.75
Valore contabile per azione 69.57
Valore contabile tangibile per azione 65.32
Liquidita' per azione 21.89
Cash flow per azione 16.93
Dividendo per azione 1.62
Dividendo dichiarato (annuale) 1.75
Indicatori economici
P/E (Prezzo/Utile) escluse compon. staordin. 3.22
P/E (Prezzo/Utile) normalizzato 2.46
P/S (Prezzo/Fatturato) 0.55
P/TB (Prezzo/Valore contabile tangibile) 0.51
Prezzo/Cash Flow 1.78
P/B (Prezzo/Valore contabile) 0.48
Solidita' finanziaria
Indice di liquidita' corrente 4.09
Indice di liquidita' immediata 3.36
Indebitamento a lungo termine/mezzi propri (trim.) 73.91
Indebitamento totale/Mezzi propri 75.34
Rapporto Utili/Dividendi 14.33
Dati di bilancio (in mln di USD)
Ricavi 1,618.82
EBITDA (Margine Operativo Lordo) 527.44
EBT (Utili ante imposte) 279.77
Reddito disponibile per gli azionisti ordinari 326.98
EBT (Utili ante imposte) normalizzati 400.73
Reddito disponibile per gli azionisti ordinari (normalizzato) 401.87
Indicatori di profitto (%)
Margine lordo 43.03
Margine di utile netto 19.46
Margine operativo 22.21
Margine ante imposte 15.91
Multipli di bilancio
ROA (rendim. delle attivita') 7.67
ROE (rendim. dei mezzi propri) 17.48
ROI (rendim. del capitale investito) 8.34
Tassi di crescita (%)
Fatturato ultimo trimestre (rispetto allo stesso trimestre dell'anno preced.) -20.91
Fatturato ultimi 12 mesi (rispetto allo stesso periodo dell'anno preced.) 28.00
Fatturato ultimi 5 anni 30.29
EPS ultimo trimestre (rispetto allo stesso trimestre dell'anno preced.) 25.90
EPS ultimi 12 mesi (rispetto allo stesso periodo dell'anno preced.) 42.55
EPS (Utili per azione) ultimi 5 anni 25.17
Dividendo ultimo anno 28.92
Legenda indicatori
I dati sono riferiti al titolo quotato sulla borsa New York Stock Exchange e aggiornati al 28/05/2009

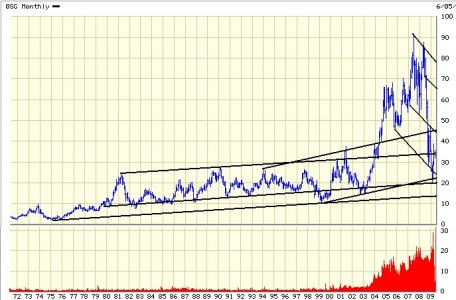
Non mi torna quel grafico... a me risulta che nel 1981 quotava oltre 20 $
http://moneycentral.msn.com/investo...MA1=0&CF=0&D7=&D6=&symbol=OSG&nocookie=1&SZ=0
Io seguo Msn e Google FinancePer la miseria: ma chi ha i dati giusti, Proph. o BigCh. ???
 ... anche se il semestre resta ampiamente positivo su tua segnalazione OSG mi sto affacciando per la prima volta nel settore Shipping, spero di approfondirne la conoscenza al più presto!
Sullo shipping c'e' anche questa bellissima discussione di Sal.VICiao Nautilus
Ciao Nautilus
Questa era la Q3 uscita a novembre:
Overseas Shipholding Q3 loss narrower than expected
Nov 2 (Reuters) - Oil transportation company Overseas Shipholding Group Inc (OSG.N) posted a narrower-than-expected quarterly loss, partly helped by lower expenses.
For the third quarter ended Sept 30, it posted a net loss attributable to the company of $19.6 million or 73 cents a compared with a profit of $197.8 million, or $6.69 a share, a year ago.
The quarter's earnings reflect a repurchase of 6 percent of total shares outstanding since Sept. 30, 2008, the company said.
Excluding certain items, the company lost 98 cents a share, compared with consensus estimates of a loss of $1.08 a share according to ThomsonReuters I/B/E/S.
Quarterly time charter equivalent revenue dropped 52 percent to $207.3 million, on declines in spot rates and total revenue days.
The company said cost cutting efforts and the redelivery of 13 vessels resulted in general and administrative expenses dropping 13 percent, while vessel expenses fell 16 percent.
Dettagli sui conti qui: http://secfilings.nyse.com/filing.php?doc=1&attach=ON&ipage=6589465&rid=12
Sullo shipping c'e' anche questa bellissima discussione di Sal.VI
http://www.finanzaonline.com/forum/showthread.php?t=1122182
La GASS piace molto anche a me. OSG, ESEA e GASS sono, in ordine, le mie shipping preferite sul Nyse, PR e DIS su MilanoGASS - http://www.finanzaonline.com/forum/showpost.php?p=23579129&postcount=233
GLNG - http://www.finanzaonline.com/forum/showpost.php?p=23579183&postcount=234
LNG - http://www.finanzaonline.com/forum/showpost.php?p=23579183&postcount=234
TGP - http://www.finanzaonline.com/forum/showpost.php?p=23579129&postcount=233[/SIZE]
Queste segnalate in blu sono le mie preferite (gassiere LNG) seguite con un apposito sub-portfolio su Tickerspy [http://www.tickerspy.com/portfolio.php?pid=90793].