Fool66
Nuovo Utente
- Registrato
- 9/7/03
- Messaggi
- 832
- Punti reazioni
- 56
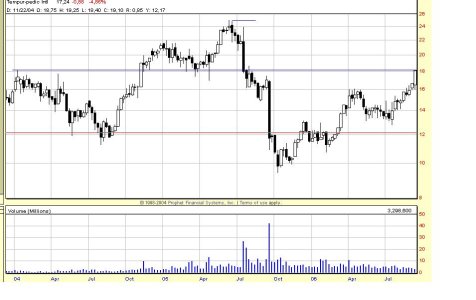
manca il post...buon titolo finora..NN PROPRIO TECNOLOGICO 
produce e smercia materassi in lattice svedesi
scovata tempo fa' nei titoli G.P. di maxlago
Market Cap (intraday): 1.42B
Enterprise Value (14-Sep-06)3: 1.90B
Trailing P/E (ttm, intraday): 16.32
Forward P/E (fye 31-Dec-07) 1: 11.94
PEG Ratio (5 yr expected): 0.89
Price/Sales (ttm): 1.73
Price/Book (mrq): 10.27
Enterprise Value/Revenue (ttm)3: 2.19
Enterprise Value/EBITDA (ttm)3: 8.78
FINANCIAL HIGHLIGHTS
Fiscal Year
Fiscal Year Ends: 31-Dec
Most Recent Quarter (mrq): 30-Jun-06
Profitability
Profit Margin (ttm): 11.59%
Operating Margin (ttm): 22.01%
Management Effectiveness
Return on Assets (ttm): 17.18%
Return on Equity (ttm): 50.26%
Income Statement
Revenue (ttm): 869.29M
Revenue Per Share (ttm): 9.435
Qtrly Revenue Growth (yoy): 13.70%
Gross Profit (ttm): 423.94M
EBITDA (ttm): 216.74M
Net Income Avl to Common (ttm): 100.73M
Diluted EPS (ttm): 1.05
Qtrly Earnings Growth (yoy): 5.10%
Balance Sheet
Total Cash (mrq): 15.81M
Total Cash Per Share (mrq): 0.191
Total Debt (mrq): 417.13M
Total Debt/Equity (mrq): 2.853
Current Ratio (mrq): 1.697
Book Value Per Share (mrq): 1.765
Cash Flow Statement
Operating Cash Flow (ttm): 139.63M
Levered Free Cash Flow (ttm): 205.21M
View Financials (provided by EDGAR Online):
Income Statement - Balance Sheet
Cash Flow
Earnings History Sep-05 Dec-05 Mar-06 Jun-06
EPS Est 0.22 0.29 0.28 0.29
EPS Actual 0.24 0.32 0.29 0.30
Difference 0.02 0.03 0.01 0.01
Surprise % 9.1% 10.3% 3.6% 3.4%
EPS Trends Current Qtr
Sep-06 Next Qtr
Dec-06 Current Year
Dec-06 Next Year
Dec-07
Current Estimate 0.32 0.38 1.28 1.44
7 Days Ago 0.32 0.38 1.28 1.44
30 Days Ago 0.32 0.38 1.28 1.44
60 Days Ago 0.31 0.37 1.26 1.41
90 Days Ago 0.31 0.37 1.26 1.41
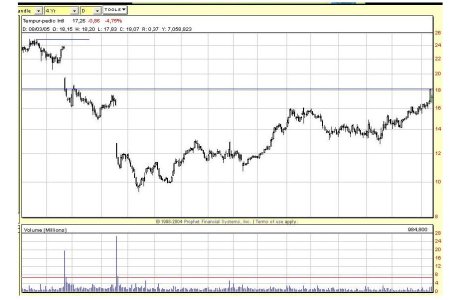