Installa l'app
How to install the app on iOS
Follow along with the video below to see how to install our site as a web app on your home screen.
Nota: This feature may not be available in some browsers.
Stai usando un browser molto obsoleto. Puoi incorrere in problemi di visualizzazione di questo e altri siti oltre che in problemi di sicurezza. .
Dovresti aggiornarlo oppure usare usarne uno alternativo, moderno e sicuro.
Dovresti aggiornarlo oppure usare usarne uno alternativo, moderno e sicuro.
Il punto della situazione 5
- Creatore Discussione simulpaolo
- Data di inizio
Più opzioni
Chi ha risposto?
simulpaolo
Gold is money
- Registrato
- 26/11/00
- Messaggi
- 22.571
- Punti reazioni
- 524
difficile che la fed possa riproporre un qe dal momento che i repubblicani in vista delle elezioni sarebbero contrari ma forse un nuovo round di operazione twist è possibile.
performance
Nuovo Utente
- Registrato
- 21/11/03
- Messaggi
- 3.216
- Punti reazioni
- 527
okkio domani al vertice g20 c'e' molta tensione tra cina,russia,usa e europa sul caso iran nn vorrei che vogliano fare iniziare le danze
simulpaolo
Gold is money
- Registrato
- 26/11/00
- Messaggi
- 22.571
- Punti reazioni
- 524
che mercato orribile fatta eccezione per qualche big cap il resto è in trend bearish o al meglio neutrale.
todi1981
Corto Maltese
- Registrato
- 19/4/11
- Messaggi
- 22.003
- Punti reazioni
- 307
Ciao Simulpaolo se ti possono essere utili le considerazioni sotto riportate:
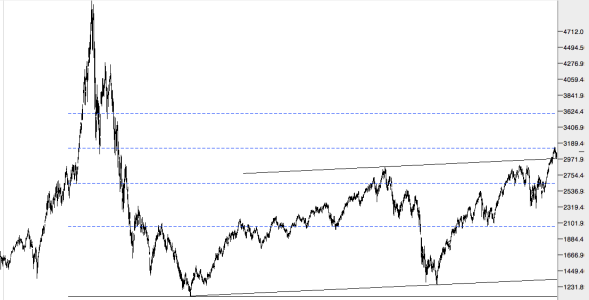
LONG TERM: bull market
Our long term position remains the same as it has for the past few years. A Supercycle wave 2 low occurred in March 2009 at SPX 667. Since then the stock market has been rising in a Cycle wave [1] bull market.
Primary I, of this five primary wave bull market, ended in May 2011 at SPX 1371, and Primary II ended in October 2011 at SPX 1075.
Primary wave III is currently underway. Within Primary III Major wave 1 completed at SPX 1293 in October and Major 2 at SPX 1159 in November. Major wave 3 appears to have completed at the April SPX 1422 high. Major wave 4 should be underway now.
The weekly chart displays the labeling from October 2002. Notice the 2002-2007 bull market was five waves. Then the 2007-2009 bear market was three waves. No other counts fit these wave patterns. Now notice how the RSI gets overbought during uptrends within bull markets, and oversold during downtrends. During the 2002-2007 bull market nearly every downtrend hit the oversold level at 30. This bull market is not doing that. Most of the downtrends have ended at around 35 at the green line. We believe this correction could end there too.
MEDIUM TERM: DOW confirmed downtrend, SPX likely to follow
The DOW has confirmed what is most likely a Major wave 3 top and Major wave 4 downtrend underway. The SPX/NDX/NAZ have yet to confirm a downtrend. For the time being this creates some alternate possibilities which were mentioned in the thursday update. Our preferred count suggests the five month uptrend, November – April, unfolded in five Intermediate waves: wave i SPX 1267, wave ii SPX 1202, wave iii SPX 1378, wave iv SPX 1340, and wave v SPX 1422. And, a downtrend is currently underway. Normal support after a bull market uptrend is usually the previous fourth wave. However, since the fifth wave was shorter than waves one and three, this level is not likely to hold. We place support within the SPX 1300 to 1340 range, with SPX 1313 to 1327 the likely target. We provided the rationale for these levels in last weekend’s update.
The typical downtrend, during this bull market, has lasted about one month. This suggests a May low. The alternation between second waves and fourth waves, in this bull market, has been complex first and simple next. This suggests this correction will be simpler than the Nov11-Dec11 Major wave 2 correction. With these two factors in mind we are expecting an ABC decline consisting of three Intermediate waves. Within each downtrending Intermediate wave we are expecting an ABC decline consisting of three Minor waves. This pattern should be sufficient to cover the distance expected in the time allotted. The first decline, SPX 1422-1357, we labeled Minor wave a of Int. A. The recent rally, SPX 1357-1388, we labeled Minor b of Int. A. The current decline, from SPX 1386, should be Minor c of Int. A. After it bottoms we should get another counter-trend rally. Then the next Minor abc decline to end the correction.
Penso come dicevo lo scorso autunno che siamo nell' onda V, quindi sono leggermente in contrasto a quanto sopra, secondo cui dovremmo essere essere nella terza, invece ritengo che siamo nella 5 onda, e concordo con te che il bull market ( a meno di una scoperta rivoluzionaria come la fusione fredda ) dovrebbe terminare tra 1550 / 1600 facendo un triplo massimo tra il 2000 e il 2012 per me le onde sono:
1 onda 667 marzo 2009 - 1.210 maggio 2010
2 onda 1.210 maggio 2010 - 1.030 ottobre 2010
3 onda 1.030 ottobre 2010 - 1.371 maggio 2011
4 onda 1.371 maggio 2011 - 1.075 ottobre 2011
5 onda 1.075 ottobre 2011 - 1.550 / 1.600..................
la 5 onda così formata:
1 onda 1.075 ottobre 2011 - 1.293 ottobre 2011
2 onda 1.293 ottobre 2011 - 1.159 novembre 2011
3 onda 1.159 novembre 2011 - 1.422 aprile 2012
4 onda 1.422 aprile 2012 - 1.300 maggio 2012
5 onda 1.300 maggio 2012 - 1.550 / 1.600.....................
Uno dei motori propulsivi di questa crescita dello Standard and Poor's è Apple ( su cui Francesco Caruso si è accanito da mesi ) su cui da ieri circolano voci dell' imminente lancio sul mercato di un 'Ipad versione economica a cui dovrebbero seguire Iphone 5 e il rivoluzionario televisore forse a Natale.
Defkalion Announces LENR Date, Mitsubishi Enters LENR Market
Gnappo
&nowRock'n'roll!!!!!
- Registrato
- 13/3/01
- Messaggi
- 3.584
- Punti reazioni
- 479
Una correzione ci sta tutta dopo l'incredibile corsa del primo trimestre...
Detto questo, le incertezze del mercato non sono solo per una crescita globale bassa, ma soprattuto per il credit market nei PIGS. Gli spread sono tornati pericolosamente a crescere.
La tendenza dello spread bonos-bund si riperquote inevitabilmente su tutti i mercati azionari. Le operazioni di LTRO hanno spostato in avanti il problema ma non l'hanno risolto..
La contraddizione di fondo è evidente. Spagna, Italia, Portogallo, Grecia si ritrovano con giganteschi problemi strutturali, debito o deficit pubblico alto, e recessione. Problemi grossi, ma non è che sono nuovi nella storia del mondo.
Quello che è totalmente nuovo è l'impossibilità del mercato di riprezzare gli assets in maniera congrua, nella fattispecie fisiologica svalutazione monetaria. Il valore del cambio Euro/Usd non è allineato con i fondamentali macroeconomici. Sia perchè la FED sta giocando sporco svalutando il dollaro, sia perchè l'Euro viene tradato come se fosse il Marco.
Non si può avere tassi di riferimento a 0,5%, pagare 5-6% di interessi sul debito e avere la valuta esageratamente forte verso i maggiori partner commerciali USA e Cina (con lo Yuan a cambio semi-fisso con il dollaro e quindi debole contro euro). E' un controsenso
ottimo...

aggiungo un grafico.... composite...
Allegati
simulpaolo
Gold is money
- Registrato
- 26/11/00
- Messaggi
- 22.571
- Punti reazioni
- 524
usdx sembra in difficolta ed in procinto di violare al ribasso il triangolo.Se cio accadesse l'euro potrebbe rimbalzare fino a 1,42 spinto dalle furiose ricoperture di longhisti del dollaro in stop loss e gli indici proiettarsi verso 1550

Ultima modifica:
mo cuishle
Love & Money
- Registrato
- 21/10/06
- Messaggi
- 20.061
- Punti reazioni
- 965
ottima osservazione Simul
todi1981
Corto Maltese
- Registrato
- 19/4/11
- Messaggi
- 22.003
- Punti reazioni
- 307
Gold and Silver update … new highs this year
April 15, 2012
OEW has had the Gold market in a long term uptrend since 2001. And, we ‘re not expecting the bull market top until the year 2014. This coincides with the 13 year commodity bull market Secular cycle.
Currently the precious metals are entering a very interesting situation. After the last report Gold bottomed about one week later within the expected bottoming range. We labeled that low Major wave 4 of the current Primary V phase of the bull market. After that low Gold rallied about $270 to $1793. This ended Intermediate wave i of Major wave 5. For the past two months Gold has been correcting in an Intermediate wave ii downtrend. It has been a bit tricky determining the actual low since the correction has been quite complex. Nevertheless, the low has occurred, or will likely occur on the next pullback. Silver has the same exact count as Gold. And, should also end its downtrend shortly.
Notice how both Gold and Silver ended their respective Major wave 4 lows, in late December, at the normal oversold MACD condition for each metal. Also observe how Gold has remained nearly entirely above the MACD neutral line since 2001. With the exception of the 2008 mass liquidation, this is typical bull market activity.
The interesting situation, we noted earlier, is quite simple from an OEW perspective. Situations like this are rare but do arise from time to time in various markets. Since Gold and Silver are, and have been, in bull markets. The quantitative feature of OEW requires both of these metals to make new all time highs before this year ends. It’s that simple!
With Gold currently trading at $1660, a new high is only about 16% higher from current levels. Nothing out of the ordinary here. One good uptrend can accomplish that. For Silver, however, a new all time high will require a couple of really good uptrends. With Silver currently trading at $31.54, a new high would require a nearly 58% advance from current levels. Since there are only about 8 months left in the year this would be quite a move. And, we are expecting it.
We conclude by suggesting there is a high probability both Gold and Silver will make new all time highs before 2012 ends. Best to your trading/investing!
simulpaolo
Gold is money
- Registrato
- 26/11/00
- Messaggi
- 22.571
- Punti reazioni
- 524
Gold and Silver update … new highs this year
April 15, 2012
OEW has had the Gold market in a long term uptrend since 2001. And, we ‘re not expecting the bull market top until the year 2014. This coincides with the 13 year commodity bull market Secular cycle.
Currently the precious metals are entering a very interesting situation. After the last report Gold bottomed about one week later within the expected bottoming range. We labeled that low Major wave 4 of the current Primary V phase of the bull market. After that low Gold rallied about $270 to $1793. This ended Intermediate wave i of Major wave 5. For the past two months Gold has been correcting in an Intermediate wave ii downtrend. It has been a bit tricky determining the actual low since the correction has been quite complex. Nevertheless, the low has occurred, or will likely occur on the next pullback. Silver has the same exact count as Gold. And, should also end its downtrend shortly.
Notice how both Gold and Silver ended their respective Major wave 4 lows, in late December, at the normal oversold MACD condition for each metal. Also observe how Gold has remained nearly entirely above the MACD neutral line since 2001. With the exception of the 2008 mass liquidation, this is typical bull market activity.
The interesting situation, we noted earlier, is quite simple from an OEW perspective. Situations like this are rare but do arise from time to time in various markets. Since Gold and Silver are, and have been, in bull markets. The quantitative feature of OEW requires both of these metals to make new all time highs before this year ends. It’s that simple!
With Gold currently trading at $1660, a new high is only about 16% higher from current levels. Nothing out of the ordinary here. One good uptrend can accomplish that. For Silver, however, a new all time high will require a couple of really good uptrends. With Silver currently trading at $31.54, a new high would require a nearly 58% advance from current levels. Since there are only about 8 months left in the year this would be quite a move. And, we are expecting it.
We conclude by suggesting there is a high probability both Gold and Silver will make new all time highs before 2012 ends. Best to your trading/investing!
credo che lo vedremo a 2200-2300 verso fine anno inizio 2013
simulpaolo
Gold is money
- Registrato
- 26/11/00
- Messaggi
- 22.571
- Punti reazioni
- 524
grande news aapl presenta il suo nuovo innovativo prodotto!! *

* disponibile per tutte le ragazze a partire dal prox mese
* disponibile per tutte le ragazze a partire dal prox mese
simulpaolo
Gold is money
- Registrato
- 26/11/00
- Messaggi
- 22.571
- Punti reazioni
- 524
avrebbe avuto più successo una versione MAXY
ci sara anche quella in forma i cock huge
Ngc-53
sunt tecum quae fugi
- Registrato
- 28/5/03
- Messaggi
- 2.719
- Punti reazioni
- 125
ci sara anche quella in forma i cock huge
basta che non la diano in omaggio a tutti gli investistori.
mo cuishle
Love & Money
- Registrato
- 21/10/06
- Messaggi
- 20.061
- Punti reazioni
- 965
vix sembra confermare il ribasso come postato ieri
Seven Of Nine
Risk/Reward
- Registrato
- 12/6/07
- Messaggi
- 8.249
- Punti reazioni
- 441
L'Oil non ne vuole sapere di scendere, +1,73% a 104.53$/bbl ...
L'Oil non ne vuole sapere di scendere, +1,73% a 104.53$/bbl ...
Allegati
simulpaolo
Gold is money
- Registrato
- 26/11/00
- Messaggi
- 22.571
- Punti reazioni
- 524
il crb index potrebbe aver esaurito la sua fase correttiva come accaduto nell aprile 2010 e dunque dovrebbe apprestarsi a risalire lentamente . Al momento il trend sembra ancora rialzista osservando il chart di lungo periodo.

simulpaolo
Gold is money
- Registrato
- 26/11/00
- Messaggi
- 22.571
- Punti reazioni
- 524
l'usdx si sta dirigendo verso 79 difatto sta provando a rompere al ribasso il triangolo di cui parlavo stamattina
Seven Of Nine
Risk/Reward
- Registrato
- 12/6/07
- Messaggi
- 8.249
- Punti reazioni
- 441
1.32 sforati...
Voglio vedere se vince Hollande le elezioni in Francia che fine fa la barzetta Euro/Dollaro dopato..

Voglio vedere se vince Hollande le elezioni in Francia che fine fa la barzetta Euro/Dollaro dopato..