Installa l'app
How to install the app on iOS
Follow along with the video below to see how to install our site as a web app on your home screen.
Nota: This feature may not be available in some browsers.
Stai usando un browser molto obsoleto. Puoi incorrere in problemi di visualizzazione di questo e altri siti oltre che in problemi di sicurezza. .
Dovresti aggiornarlo oppure usare usarne uno alternativo, moderno e sicuro.
Dovresti aggiornarlo oppure usare usarne uno alternativo, moderno e sicuro.
Morgan Stanley Global Opportunity (A) LU0552385295 (B) LU0552385378
- Creatore Discussione Eurimaco
- Data di inizio
Più opzioni
Chi ha risposto?- Registrato
- 12/2/08
- Messaggi
- 13.182
- Punti reazioni
- 353
Io, da un paio di annivisto che i mercati sono tendenzialmente un po' altini... volevo entrate con un pac su questo fondo azionario globale... Qualcuno lo conosce o ce l' ha in portafoglio ? ciao")
http://www.finanzaonline.com/forum/38466514-post80.html
Ma in classe A
Performance del Fondo |Rendimenti Annuali, Cumulati e Trimestrali |Morgan Stanley Investment Funds Global Opportunity A (EUR)|ISIN:LU0552385295
Commissioni sui Fondi|Expense Ratio|Morgan Stanley Investment Funds Global Opportunity A (EUR)|ISIN:LU0552385295
L' isin che hai scritto è della classe B che è gravata da un 1% in più all' anno di commissioni , che va al collocatore.
La classe B di MS per i sottoscrittori è da evitare
Commissioni sui Fondi|Expense Ratio|Morgan Stanley Investment Funds Global Opportunity Fund B Acc (EUR)|ISIN:LU0552385378
- Registrato
- 12/2/08
- Messaggi
- 13.182
- Punti reazioni
- 353
Alcune note biografiche e un' intervista di fine maggio '15 al gestore di MS Global Opportunity , Kristian Heugh , che spiegava in base a quali criteri sceglie le azioni in cui investire, azioni di società uniche con un vantaggio competitivo, aziende in grado di crescere, con una elevata redditività del capitale investito.
By Thomas Streater
May 28, 2015 9:04 p.m. ET
Kristian Heugh has been investing since he was 10 years old. His first investment was a five share position in Coca Cola right before the company embarked on a large international expansion. The stock did well and the young boy was hooked.
After graduating Duke University, Heugh joined Morgan Stanley Investment Management and was soon in charge of a portion of technology coverage. Frequent trips to Asia starting around 2001 proved instructive, where he witnessed Asia’s growth first-hand. He has been part of MSIM’s global opportunities strategy group since it was launched in 2007, and has developed a knack for finding companies with strong competitive advantages.
As he puts it, competitive advantage is “the most important attribute of a business when making long term investments - that is the secret sauce” to sustainable generation of alpha, or absolute returns.
Heugh, who moved to Hong Kong in 2008 and is a CFA charterholder, sat down with Barron’s Asia recently in a Morgan Stanley meeting room overlooking Hong Kong harbor to discuss his views on finding great investments in Asia.
Barron’s Asia: The global opportunities strategy has outperformed in the last few years. What’s your investment philosophy?
Heugh: The way to discuss our investment philosophy would be to call it Warren Buffett investment principles for growing companies. He describes competitive advantage as being a moat, and while of course we agree with the Oracle of Omaha, we prefer to describe it as uniqueness. We want to own a collection of unique companies. A company is unique when it performs a function in society that’s important and not easily replicated. Bargaining power of suppliers and customers, availability of substitute products, barriers to entry, the regulatory environment, and the intensity of competition against rivals are all critical to understanding a company’s uniqueness. Then we look how companies can monetize their businesses.
If a company is very unique, has the ability to achieve high return on capital by investing capital wisely on behalf of shareholders and is trading at a large discount to intrinsic value, then you have a potentially lucrative investment opportunity. These are the types of opportunities we’re seeking.
Q: How do you look at intrinsic value?
A: This is not measured by price-to-earnings or any other short-term metric, but rather through an understanding of pricing, volumes, margins and the long-term free cash flow yield of a business.
...
Kristian Heugh on Stocks with Competitive Edge
Bing Traduttore
Bluerating.com
FondiOnLine.it
Tech rally drives indexes; S&P 500 positive for year | Reuters
DonaldDuck
Nuovo Utente
- Registrato
- 28/4/15
- Messaggi
- 455
- Punti reazioni
- 41
questi fondi sono sottoscrivibili tramite qualsiasi banca? in caso affermativo come si possono ridurre le commisioni d'entrata visto che non vi è la possibilità di parlare direttamente con qualche responsabile della Morgan?
- Registrato
- 12/2/08
- Messaggi
- 13.182
- Punti reazioni
- 353
questi fondi sono sottoscrivibili tramite qualsiasi banca? in caso affermativo come si possono ridurre le commisioni d'entrata visto che non vi è la possibilità di parlare direttamente con qualche responsabile della Morgan?
Sono sottoscrivibili tramite banche e SIM che abbiano un contratto di collocamento con certe sicav.
Ormai ci sono diverse banche e SIM che collocano MS e parecchie altre sicav e SGR.
Di solito società di gestione come Morgan Stanley non incassano le commissioni d' entrata , che possono essere incassate dai collocatori.
Su tutti i fondi collocati Sella.it , CheBanca! e Webank non applicano commissioni d' ingresso.
Ho appena controllato che tramite Onlinesim, Fundstore e Sella.it LU0552385295 è sottoscrivibile con commissioni di ingresso azzerate ( 0,00 % )
aquila della not
Nuovo Utente
- Registrato
- 6/9/12
- Messaggi
- 379
- Punti reazioni
- 8
un poò volatile eh ! belle escursioni
consindip
Nuovo Utente
- Registrato
- 18/7/08
- Messaggi
- 6.067
- Punti reazioni
- 586
Anni fa MS aveva un fondo chiamato Competitive Edge Best Ideas, portafoglio azionario globale concentrato sulle migliori idee di investimento, titoli con multipli molto elevati, .....chissà poi perchè quando prendono le legnate li chiudono
- Registrato
- 12/2/08
- Messaggi
- 13.182
- Punti reazioni
- 353
Nel 2015 lo stile growth ha vinto nettamente il confronto con lo stile value.
In un contesto economico generale di bassa crescita nei paesi sviluppati e di crescita in calo nei paesi emergenti gli investitori hanno preferito acquistare azioni di società
caratterizzate dalla capacità di crescere in misura notevole anche in tale contesto. Alcune società possono giustificare valutazioni a premio perché hanno punti di forza sostenibili nel tempo.
La questione interessante riguarda cosa succederà nel 2016.
È vero che certi investimenti azionari diversificati dovrebbero essere per il lungo periodo, ma non fa piacere avere fondi azionari che in un certo anno vanno nettamente peggio ( salendo meno o perdendo di più) di quelli con diversa impostazione.
ACMBernstein Global Value Portfolio A,
anche se nel 2015 e a 3 anni ha reso più della media di categoria Azionari Internazionali Large Cap Value e più dell' indice MSCI World Value ( ha il Fund manager attuale dal 3/2012 ) ,
presenta una performance decisamente inferiore a quella di vari fondi azionari internazionali Large cap Growth, soprattutto nel 2015.
ACMBernstein Global Value Portfolio A|LU0124673897
Un' altro possibile criterio di selezione delle azioni è quello Quality, lo scegliere azioni di società di qualità con utili e fatturato abbastanza stabili, con moderata crescita ma senza crolli ciclici ( in estrema sintesi).
Un articolo di Barron's parla di alcune delle Large cap con performance più elevata a Wall Street nel 2015 e delle prospettive per il 2016.
TIERNAN RAY
December 26, 2015
Because Wall Street loves to get more of what it already knows it loves, get ready for “FANG 2: The Sequel” in 2016.
FANG, of course, is the infamous acronym for four of the best-performing stocks of 2015, Facebook (ticker: FB), Amazon.com (AMZN), Netflix (NFLX), and Google, now Alphabet (GOOGL).
It’s a good bet these four horsemen will continue to deliver in the New Year. They are generating better-than-average growth, are not replicable, and they aren’t going away anytime soon, even in the case of Amazon, where there are virtually no earnings.
Facebook still has a long runway to capture new advertising dollars that are leaving old media such as print and television. And for the foreseeable future, its properties, including its namesake and the photo-sharing service Instagram, are unrivaled in terms of brand recognition for “engagement” of online users, at least as far as ad buyers are concerned.
Alphabet is expected to reveal more information in January, when it reports results, about how much money it has been losing in its experiments—robots, self-driving cars—outside the core search business at Google. It could reveal more about YouTube, its second-largest business, as well (see cover story). That transparency could make investors more comfortable with the business.
Amazon, along with Microsoft (MSFT), has totally changed information-technology buying by bringing workloads that used to run on corporate computers onto their cloud operations. That trend may cool at some point, but not in 2016.
The FANG will benefit from a winding-down of private-market activity, with the slowing of investment in the so-called unicorns. Those are private companies with extraordinary valuations, such as Uber, the ride-sharing service most recently valued at $65 billion. Press reports suggest private-market valuations have fallen as venture investors realize the most ambitious expectations for these companies won’t hold up in public markets.
The most challenging factor is that the valuation multiples have expanded for most of the FANG four.
Going one by one, Facebook, at a recent price of $105.02, has actually gotten cheaper, and is trading at 37 times projected earnings for next year, 2016, of $2.85. A year ago at this time, Facebook was trading for 42 times what was then the projection for 2015, which was $1.93.
Amazon, at a recent $662.79, trades for 121 times 2016 estimates, up from a 74 multiple a year ago, based on its earnings estimate at the time.
And Alphabet, at a recent $765.84, trades for about 22 times 2016’s estimates, up from 20 times a year ago.
At a recent $117.33, Netflix fetches an insane 293 times next year’s projected earnings. It has soared in valuation from a mere 64 times a year ago, after adjusting for the company’s 7-for-1 stock split this summer. This is the most “stretched” valuation of the group and perhaps the least likely to produce additional gains as a result.
More vibrant than FANG will be the speculative returns to be had in mergers and acquisitions in tech. The window is closing for cheap funding, as the Federal Reserve has commenced its tightening phase with the first fed funds rate hike in almost a decade. Eventually, rising rates will turn off the spigot for leveraged buyouts of companies. In the meantime, however, that should prompt increased M&A activity as companies try to get deals done before that window closes.
Some of the primary candidates should be some of the smaller Internet companies, such as Yelp (YELP) and the food-delivery service GrubHub (GRUB). It seems unlikely that these minnows will still exist as independent outfits by the end of 2016 amidst the Web’s whales.
WHAT HAPPENS TO Old Tech, like Cisco Systems (CSCO) and Hewlett Packard Enterprise (HPE), as funds again flow to FANG? This will be a challenging year, as both try to improve their growth outlook. Their wares have been, to a certain extent, eclipsed by the move to the cloud, which commoditizes much of technology and steals some direct corporate sales.
The Street sees Cisco’s sales rising just a fraction of a percent this fiscal year ending in July, though things should get better in fiscal ’17, with a 3.6% rise. HPE is expected to see sales fall 2.5% through October 2016. The two stocks, with dividend yields of 3.15% and 1.55%, respectively, are merely decent, not stellar, but they may draw some income investors in a world of rising rates.
Microsoft is one of the better old-tech beneficiaries of cloud computing, as it is No. 2 behind Amazon, as my colleague Alexander Eule explored in last week’s cover story (“Growth Machine,” Dec. 21).
As Alex’s story made clear, the best reason Microsoft will probably notch further gains in 2016, after a 20% gain this year, is that its stock is catching up from doing nothing for about a decade before Chief Executive Satya Nadella took the helm in 2014.
A COUPLE OF smaller companies will gain in 2016 as they supply the cloud. Networker Arista Networks (ANET), a winner in 2015, should again see gains, as there is no indication that Cisco will catch the company anytime soon in the market for network switching, which is Arista’s main business. Another supplier that could benefit is Red Hat (RHT), the distributor of Linux software. Linux is being used by everyone, including Microsoft, to build cloud computing, and Red Hat has managed to partner with Microsoft and most everyone else.
Some of the best deals in Old Tech will still be the semiconductor names, with the benchmark Philadelphia Semiconductor Index having trailed the market this year. Although an excellent company, Qualcomm (QCOM), the largest provider of smartphone modem chips, has become something of an enigma after a year of turmoil, including activist agitation. At a recent $49.55, the stock trades for just 10 times next year’s projected earnings, if you are keen to speculate on a rebound of some kind.
And as this magazine opined in a cover story in October (“The Cloud Chip,” Nov. 2), Micron Technology (MU), the maker of memory chips, has some of the most valuable assets in the industry. Its shares have been devastated this year by falling chip prices. They should rebound in 2016 as the company reduces costs and sees some relief from price declines.
Microsoft, Arista Networks, Red Hat, and Micron Could Prosper in 2016
https://translate.google.it/?hl=it
Ultima modifica:
- Registrato
- 12/2/08
- Messaggi
- 13.182
- Punti reazioni
- 353
Anni fa MS aveva un fondo chiamato Competitive Edge Best Ideas, portafoglio azionario globale concentrato sulle migliori idee di investimento, titoli con multipli molto elevati, .....chissà poi perchè quando prendono le legnate li chiudono
Ho cercato se si trovano ancora informazioni su quel fondo.
Era insolito per il fatto di essere basato sulle azioni preferite del dipartimento di ricerca di MS , il portafoglio era basato sulle azioni selezionate dagli analisti. Leggendo qualche nome potevano non essere caratterizzate da multipli particolarmente elevati. Ma pare che non fosse mai andato bene.
MS aveva deciso che fosse meglio chiuderlo nel 2002 e far scegliere le azioni dai team di gestori.
By PATRICK McGEEHAN
Published: July 7, 2002
SEVERAL big investment firms offer mutual funds that show off their analysts' stock-picking prowess by buying their favorite stocks. But Morgan Stanley has come up with a better idea: dropping its ''best ideas'' fund after four years of subpar returns.
Morgan Stanley, which boasts that it has one of the world's finest teams of stock analysts, told shareholders of its Competitive Edge Best Ideas fund that it would be renamed and overhauled under new management by the end of this month. That decision came after a short-lived plan to merge the fund into a very different fund, Dividend Growth Securities.
The performance of the Competitive Edge fund has been a poor advertisement for Morgan Stanley's stock selection: the fund lost 8.68 percent of its value last quarter, dropping its three-year annualized return to a loss of 11.83 percent. By comparison, its benchmark, the MSCI Europe, Australasia and Far East, or EAFE, index, had a three-year annualized loss of 6.78 percent.
Though the idea of a fund that picks the brains of analysts at one of the biggest Wall Street firms might have once seemed seductive, it has generally been a dud.
''It really surprises me that the best ideas of analysts are always so incredibly run-of-the-mill, so unoriginal'' said Gabriel Presler, an analyst at Morningstar Inc. ''They sound great and they're a great marketing tool. But they just don't seem to be very different. I'm perplexed.''
In February, UBS changed the way it picks stocks for the UBS Strategy fund, which was founded on the broad investment themes espoused by Edward M. Kerschner, the chief strategist for UBS. In little more than two years of operation, it had lost more than half of its value.
Another big investment bank, the Goldman Sachs Group, is contemplating some changes in the way it runs the Goldman Sachs Research Select fund, which lost 18.1 percent last quarter and has now lost more than half its value in two years.
One of the few ''best ideas'' funds with a decent track record is MFS Research. It has gained almost 11 percent annually over the last 10 years, but it, too, has suffered lately. It lost 14.9 percent last quarter, knocking its three-year annualized return down to a loss of 10.2 percent.
At Morgan Stanley, shareholders apparently noticed the failure of the promise. The fund, once had about $2 billion in assets, but now has about $600 million, a Morgan Stanley spokesman said. Mark Bavoso, who has managed the fund since its inception in 1998, declined to comment.
Morgan Stanley says the fund's short list of large growth stocks, including Wal-Mart Stores, Sony and BMW, prevented it from tracking its benchmark index. Holding shares of about 40 companies that were expected to grow fast was a strategy built for a global bull market, not the worldwide slump of the last two years, an official of the firm said.
As of the end of June, the fund had underperformed its benchmark for the previous day, week, month, quarter, year and three years, according to Morningstar. For that service, Morgan Stanley has charged a 5.25 percent commission, and expenses have eaten up more than 1 percent of the firm's assets annually.
''This fund definitely needed a face lift,'' Ms. Presler at Morningstar said. Since 1999, she said, its performance has been lackluster.
The revamped fund, to be called Morgan Stanley Global Advantage, will no longer hold 40 stocks chosen primarily from a list compiled by the firm's research department, a Morgan Stanley spokesman said.
Instead, it is expected to own shares of more than 100 companies worldwide, improving the fund's chances of tracking its benchmark. It will be managed by members of Morgan Stanley's Global Core investing team in London.
...
Mutual Funds Report - Best Ideas, Rethought - NYTimes.com
Forse un aspetto negativo di quel fondo era la rotazione del portafoglio pari a circa il 50% annuale.
Può darsi che certe selezioni di azioni fossero funzionali per fornire idee a clienti che volevano comprare e vendere nell' arco di un anno ma meno adatte per un fondo che può investire in azioni per il lungo termine.
Un fondo di Best ideas
Il fondo di MS con multipli più elevati dovrebbe essere Morgan Stanley Investment Funds US Growth Fund A Acc che in una classe esiste dal 1998 , in una dal 1997 e forse in un' altra ancora dal 1993 ( sulle schede morningstar é scritto che ha un gestore dal 1993 , performance col grafico interattivo si vedono dal 1997-1998).
Per cui ha attraversato 2 mercati orso molto negativi senza che sia stato chiuso.
Morgan Stanley Investment Funds US Growth Fund A ...|LU0073232471
Morgan Stanley Investment Funds US Growth Fund A ...|LU0073232471
Ultima modifica:
- Registrato
- 12/2/08
- Messaggi
- 13.182
- Punti reazioni
- 353
Può essere interessante rileggere adesso un articolo del 2001 su Mary Meeker, analista di Morgan Stanley fino al 2010 ( quando ha lasciato MS per diventare partner di una società di Venture Capital ).
By Peter Elkind Reporter Associates Mary Danehy, Jessica Sung, Julie Schlosser
May 14, 2001
...
It was a sign of those strange times that a Wall Street analyst could excite such fascination. Then again, Morgan Stanley's Mary Meeker was no ordinary analyst. Anointed by Barron's as "Queen of the Net," lovingly profiled by The New Yorker, equated with Alan Greenspan and Warren Buffett as a market mover by the Wall Street Journal, Meeker was the unquestioned diva of the Internet Age. Tech companies begged her to cover them. Morgan Stanley paid her an eye-popping $15 million in 1999. Ordinary investors hounded her for autographs. During the dot-com craze, Mary Meeker was by far the most important voice for the Internet--and the notion that companies without earnings could transform the world and climb to the moon.
...
Yet even now Meeker is not ready to concede that these stocks are disasters, even with Priceline at $4 (from $162), Yahoo at $19.50 (from $237), and Amazon at $15 (from $106). On the contrary, she insists that they still deserve their "outperform" rating. After the "nuclear winter," she says, we'll see "the spring bloom" for her favorite stocks. Sometime within the next two to three years, the "aggregate" valuation of the "leading names" that make up her recommended list will exceed even the heights they reached during the dot-com bubble. Says Meeker: "Our bet is that the winners that come out of this, the market value of the leaders, are going to make all the things that came before them look like chump change."
...
Where Mary Meeker Went Wrong She may be the greatest dealmaker around. The problem is, she's supposed to be an analyst. - May 14, 2001
https://en.wikipedia.org/wiki/Mary_Meeker
Anche se sul breve termine sarebbero scese ancora , Mary Meeker aveva ragione sulle prospettive di lungo termine di Priceline ( ieri a $ 1274,95 ) e Amazon che ieri era a $ 675,89.
È servito più tempo di quel che pensava , ma hanno stabilito nuovi massimi e hanno raggiunto quotazioni molto più elevate di quelle del 2000, con notevole espansione del giro d' affari.
PCLN: Summary for The Priceline Group Inc. - Yahoo! Finance
AMZN: Summary for Amazon.com, Inc.- Yahoo! Finance
Yahoo! rispetto a certi prezzi del 2001 è salita ma è ampiamente sotto i massimi del 1999-2000 , anche perché è emerso un concorrente come Google, di cui peraltro nel 2004 Morgan Stanley , con M. Meeker come analista principale del settore internet , era stata lead manager del collocamento in borsa
YHOO: Summary for Yahoo! Inc.- Yahoo! Finance
Ultima modifica:
- Registrato
- 12/2/08
- Messaggi
- 13.182
- Punti reazioni
- 353
Bob Pisani
Wednesday, 23 Dec 2015 | 2:30 PM ET
...
With many Energy and Material stocks down 20 percent or more, it makes perfect sense to be buying them now, in a seasonally strong period of the year, with tax-loss selling abating, and with traders looking for a few percentage points gain to end the year on a positive note.
...
On a longer-term level,Value versus Growth for 2016 is the big investment
debate on trading desks right now.
The iShares S&P500 Value ETF (IVE), down 4 percent this year, is up 1.3 percent today, more than twice the performance of the iShares S&P 500 Growth ETF, which is up 4.7% year to date.
Many Growth names are being sold today. Nike is the outstanding example, up 30 percent or so this year, being sold on heavy volume today, despite a strong earnings report. It's not just Nike — big 2015 winners like Activision , Facebook , and Priceline are all down today.
The biggest losers (all Value) this year: Freeport McMoran, Williams, Southwest Energy, Range Resources, Devon — all down roughly 50 percent or so on the year...are the biggest gainers today, all up 10 percent or more today
What's the difference? Growth is traditionally associated with companies that are regularly growing earnings (duh).
Value is a bit trickier to define. It's usually associated with flat or declining earnings growth, a higher dividend yield (often because prices are down), and low price-to-book ratio and/or a low price-to-earnings ratio.
Traditionally, Value is associated with consumer names like Campbell Soup and Kimberly-Clark . But for 2015, Value was most associated with Energy and Materials. But it also dragged in regional banks like Huntington Bancshares and Fifth Third. And even many retailers like Kohls and Wal-Mart.
It's easy to argue for a short-term pop in Energy and Materials. Making a shot at Value as a strategy outperformer for 2016 is a tougher sell.
Here's why: For Value to work, several things would have to go right:
1) Oil rises, even if modestly;
2) The global economy expands, even if modestly;
3) The Fed is very slow on its interest rate hikes.
Doesn't sound like much, but that's a fairly tall order. The consensus is that we get another year of below-trend growth and that oil will struggle to rise, at least in the first half of the year.
So which wins long-term, Value or Growth? This is an old, old debate. Investment firm Gerstein Fisher recently published a paper noting that there have been long periods of dominance between the two:
July 1926 to 1944: Growth wins
1945 to 1962: Value wins
1963 to 1980: Value wins
1981 to 1998: Value wins
1999 to July 2015: Growth wins
Over much shorter time periods, however, it can be a bit of a coin toss. But when you have years like 2015 — with Energy down 22 percent and Materials down 9 percent — it is not a surprise that this debate is a little more vigorous than usual.
Value versus growth is the big investment debate for 2016
Translate Free Online | Language Translation
- Registrato
- 12/2/08
- Messaggi
- 13.182
- Punti reazioni
- 353
Nel 2015 spicca la performance superiore di +32,20% di Morgan Stanley Investment Funds Global Opportunity A €
Sono andati bene anche MS US Advantage A
e MS US Growth Fund A
Asset Allocation del Fondo |Primi 10 titoli in portafoglio |Morgan Stanley Investment Funds US Advantage A (EUR)|ISIN:LU0225737302
Asset Allocation del Fondo |Primi 10 titoli in portafoglio |Morgan Stanley Investment Funds US Growth Fund A Acc (EUR)|ISIN:LU0073232471
Materiale sul prodotto - Italia: Investitore Professionale - Morgan Stanley Investment Management
Tutti e 3 i fondi avevano tra le prime 6 partecipazioni Facebook , Amazon.com e Alphabet ( Google ) al 30/11/2015. I fondi US le avevano come prime 3 partecipazioni.
Facebook e Amazon hanno contribuito a tenere alto il P/E medio del portafoglio. Comunque certi multipli come il trailing P/E sono poco attendibili per stabilire se un' azione è da comprare, vendere o mantenere. Coloro che un anno fa compravano azioni del settore petrolifero perché il trailing P/E era basso se ne sono pentiti in molti casi, se non avevano sfruttato un rimbalzo di brevissimo termine.
IBM nel 2013 e nel 2014 aveva un P/E abbastanza contenuto ma poi sono arrivati risultati deludenti e l' azione complessivamente era scesa. Il P/E di Wal-Mart Stores un anno fa non era alto ma nel 2015 la performance di WMT è stata molto negativa.
Trailing Price-To-Earnings (Trailing P/E) Definition | Investopedia
Quei 3 fondi non avevano azioni del settore energetico/petrolifero.
MS Global Opportunity tra le prime partecipazioni al 30/11 aveva EPAM Systems, Inc. (EPAM) -NYSE .
EPAM: Summary for EPAM Systems, Inc. Common Stock- Yahoo! Finance
In alcune schede di EPAM si legge come P/E (ttm): 53.48. Questo dato registra gli utili passati.
Ma tenendo conto degli utili previsti per i 12 mesi successivi il P/E scende a 23.82.
http://finance.yahoo.com/news/epam-named-best-software-development-130000651.html
Ultima modifica:
- Registrato
- 12/2/08
- Messaggi
- 13.182
- Punti reazioni
- 353
Al 30/11/2015 MS Global Opportunity A investiva negli USA il 54,41%
Asset Allocation del Fondo |Primi 10 titoli in portafoglio |Morgan Stanley Investment Funds Global Opportunity A|ISIN:LU0552385295
Henderson Gartmore Fund - Global Growth Fund R€ Acc investiva negli USA il 60,65%.
Tra le prime 10 partecipazioni aveva anche Amazon.com e Alphabet ( Google).
Non aveva azioni del settore energia, che comunque negli indici growth pesa meno che in altri.
Asset Allocation del Fondo |Primi 10 titoli in portafoglio |Henderson Gartmore Fund - Global Growth Fund R
Vontobel Fund - Global Equity B investiva negli USA il 66,66%.
Tra le prime 10 partecipazioni aveva MasterCard , Alphabet ( Google) e Visa, che erano anche nella top 10 di MS Global Opportunity
Asset Allocation del Fondo |Primi 10 titoli in portafoglio |Vontobel Fund - Global Equity B|ISIN:LU0218910536
Threadneedle Global Extended Alpha Net 1 EUR Acc
al 30/11/2015 investiva negli USA il 62,03% .
Tra i primi 10 Titoli aveva Alphabet , Visa e Facebook , ma FB con una percentuale che era nettamente inferiore a quella del portafoglio di MS Global Opportunity.
Asset Allocation del Fondo |Primi 10 titoli in portafoglio |Threadneedle Specialist Investment Funds - Threadneedle Global Extended Alpha Net 1 EUR Acc|ISIN:GB00B3B0FD70
- Registrato
- 12/2/08
- Messaggi
- 13.182
- Punti reazioni
- 353
Il 2015 è stato favorevole per lo stile growth, ma ho notato un fondo azionario USA growth che aveva una buona performance pluriennale fin verso metà aprile 2015 , però da allora ha sottoperformato drasticamente:
Legg Mason ClearBridge US Aggressive Growth Fund Class A .
Questo fondo al 30/11/2015 investiva nel settore Energia il 13,14 % ( circa il quadruplo della media di categoria) .
Sovrappesava decisamente i settori Salute e Servizi alla comunicazione .
Sottopesava fortemente il settore finanziario.
Inoltre più di altri fondi investiva in Medium cap ( oltre il 40% del ptf , mentre altri fondi della stessa categoria investivano meno del 20% o meno del 15% del ptf).
Asset Allocation del Fondo |Primi 10 titoli in portafoglio |Legg Mason ClearBridge US Aggressive Growth Fund Class A USD Acc|ISIN:IE00B19Z9Z06
Asset Allocation del Fondo |Primi 10 titoli in portafoglio |Legg Mason ClearBridge US Aggressive Growth Fund Class A EUR Acc|ISIN:IE00B19ZB094
Della stessa casa di gestione è stata nettamente superiore la performance 2015 di
Legg Mason ClearBridge US Large Cap Growth Fund Class A EUR Acc,
che presenta anche una buona performance a 3 e 5 anni
Asset Allocation del Fondo |Primi 10 titoli in portafoglio |Legg Mason ClearBridge US Large Cap Growth Fund Class A EUR Acc|ISIN:IE00B19Z9612
Asset Allocation del Fondo |Primi 10 titoli in portafoglio |Legg Mason ClearBridge US Large Cap Growth Fund Class A USD Acc|ISIN:IE00B19Z9505
ottima performance 2015 e anche buona performance a 3 anni ( ha i gestori attuali dal marzo 2012) per
ACMBernstein American Growth Portfolio A
Asset Allocation del Fondo |Primi 10 titoli in portafoglio |ACMBernstein American Growth Portfolio A|ISIN:LU0079474960
https://www.abglobal.com/investment...px?cid=91927&listType=FactSheet&download=true
- Registrato
- 12/2/08
- Messaggi
- 13.182
- Punti reazioni
- 353
L' importanza di azioni di società internet vincenti
Con il declino delle performance dei paesi emergenti è passato di moda l' acronimo BRIC.
Il 2015 è stato l' anno dei FANG , acronimo per Facebook, Amazon, Netflix, Google, 4 società a grande capitalizzazione con attività legata a internet.
Facebook, Amazon, Netflix, Google Lead Internet Stocks
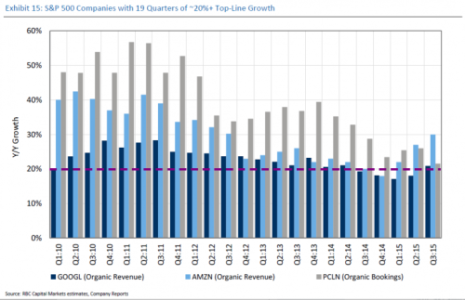
Negli ultimi 23 trimestri Google, Amazon.com e Priceline hanno registrato crescita delle entrate di circa il 20% o piu' , con qualche trimestre di crescita di poco inferiore al 20% per Facebook e Google tra 2014 e prima parte del 2015.
È previsto che la crescita secolare di settori legati a internet prosegua.
Secondo RBC Capital Markets il 2016 potrebbe essere l' anno di un altro acronimo, BAGEL : Alibaba (BABA), Amazon, Google, Expedia, LinkedIn.
Dec 30, 2015 at 7:27 PM
By Michelle Jones
This year has proven to be the year of FANG (Facebook, Amazon, Netflix, Google), but will those stocks’ momentum carry into 2016? This has been a topic of heated debate, but at least one firm is arguing that next year the big internet trades will follow a new acronym: BAGEL, which stands for Alibaba (BABA), Amazon, Google, Expedia, and LinkedIn (of course, you could always just flip a coin).
Internet stocks broadly outperform
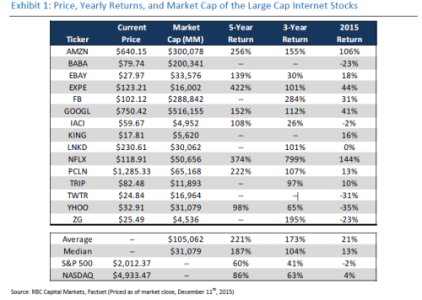
RBC Capital Markets noted that the Internet sector performed very well this year, although large cap stocks in the sector posted incredible performance. The FANG group posted an average increase of 81% in 2015, which means the valuations of all of the stocks aren’t nearly as compelling as they were a year ago. And FANG weren’t the only large cap Internet stock to smash the rest of the market this year. In all, RBC reports that 11 large cap stocks in the sector outperformed the market.
At the opposite end, however, we have small cap Internet stocks, which underperformed the market broadly. Among these stocks are AOL, King Digital, and Zulily. Six merger and acquisition deals among small cap Internet stocks accounted for nearly all of the outperformance for the small cap sector, and ten of the small cap Internet stocks fell by more than 20% this year.
Facebook, Amazon, Netflix, Google: a.k.a. FANG
In 2015, Facebook climbed 31%, Amazon was up 106%, Netflix skyrocketed by 144%, and Google parent company Alphabet rose 41%. Looking at the broader collection of large cap Internet stocks, the average stock returned 21%, while the average small cap Internet stocks declined 11%.
But not all large cap Internet stocks were strong performers this year. Twitter, Yahoo, Alibaba and Zillow didn’t have such great years. The biggest underperformers among large cap Internet stocks were Yahoo, Twitter and Alibaba, with Twitter repeating its pathetic stock price performance from 2014 this year.
Their sad performances weren’t enough to drag down large caps, however, as FANG boosted the whole large cap portion of the Internet sector to an average return of 21% and 13% at the media, reports RBC. Here’s a look at the performances of the 15 large cap Internet stocks the firm covers:
http://41.media.tumblr.com/23b6ca9247f05d905f0c5b1e8bc94ddf/tumblr_inline_o074yaxx8M1s8ylxw_500.png
Secular growth to continue in Retail, Advertising, Travel
Despite FANG’s searing outperformance in 2015, two stocks managed to make it onto RBC’s hot list again this year, and they are Google and Amazon. According to RBC analysts, the top three outperformers in their large cap Internet coverage universe were Netflix, Amazon and Expedia, which returned an average of 98% and contrasted sharply with 2014 as both Netflix and Amazon ended the year in the red.
For 2016, the RBC team likes Online Advertising, Retail and Travel, noting that their growth rates have been consistent and accelerated in some areas over the last few years. For example, Alphabet has posted between 16% and 21% growth in organic ad revenue over the last 11 quarters. Facebook has also posted consistent growth rates.
Looking at Retail, Amazon has seen Retail revenue growth of 17% to 24% for the last ten quarters, hitting a three-year high of 27% in the third quarter of this year. In Online Travel, Expedia and Priceline have also posted consistent growth rates over the last three years, with Expedia seeing rates between 23% and 30% over the last seven quarters.
Unit growth trends
When looking at units, RBC analysts argue in favor of Alibaba, Yelp, Netflix, LinkedIn, Expedia, Priceline, Amazon and Alphabet. They note that unit growth rates have been decelerating, but they were still mostly robust this past year in both large and small caps. In fact, some have even seen more than 20% growth year over year in key metrics.
http://40.media.tumblr.com/003cddb33a7600aa5f005d82d5aa40dc/tumblr_inline_o07500eJvO1s8ylxw_500.png
Over the last 23 quarters, only three companies have continued to see revenue growth of about 20% or more on a run rate of more than $10 billion, and they are Google, Amazon and Priceline. Although Google and Amazon did miss these numbers slightly late last year and early this year, their overall growth trends have remained “impressive,” the RBC analysts said because of their huge sizes.
ValueWalk
http://36.media.tumblr.com/84d7da3b816d214ebf586ab1babce998/tumblr_inline_o0750iZCHJ1s8ylxw_500.png
Con il declino delle performance dei paesi emergenti è passato di moda l' acronimo BRIC.
Il 2015 è stato l' anno dei FANG , acronimo per Facebook, Amazon, Netflix, Google, 4 società a grande capitalizzazione con attività legata a internet.
Facebook, Amazon, Netflix, Google Lead Internet Stocks
Negli ultimi 23 trimestri Google, Amazon.com e Priceline hanno registrato crescita delle entrate di circa il 20% o piu' , con qualche trimestre di crescita di poco inferiore al 20% per Facebook e Google tra 2014 e prima parte del 2015.
È previsto che la crescita secolare di settori legati a internet prosegua.
Secondo RBC Capital Markets il 2016 potrebbe essere l' anno di un altro acronimo, BAGEL : Alibaba (BABA), Amazon, Google, Expedia, LinkedIn.
Dec 30, 2015 at 7:27 PM
By Michelle Jones
This year has proven to be the year of FANG (Facebook, Amazon, Netflix, Google), but will those stocks’ momentum carry into 2016? This has been a topic of heated debate, but at least one firm is arguing that next year the big internet trades will follow a new acronym: BAGEL, which stands for Alibaba (BABA), Amazon, Google, Expedia, and LinkedIn (of course, you could always just flip a coin).
Internet stocks broadly outperform
RBC Capital Markets noted that the Internet sector performed very well this year, although large cap stocks in the sector posted incredible performance. The FANG group posted an average increase of 81% in 2015, which means the valuations of all of the stocks aren’t nearly as compelling as they were a year ago. And FANG weren’t the only large cap Internet stock to smash the rest of the market this year. In all, RBC reports that 11 large cap stocks in the sector outperformed the market.
At the opposite end, however, we have small cap Internet stocks, which underperformed the market broadly. Among these stocks are AOL, King Digital, and Zulily. Six merger and acquisition deals among small cap Internet stocks accounted for nearly all of the outperformance for the small cap sector, and ten of the small cap Internet stocks fell by more than 20% this year.
Facebook, Amazon, Netflix, Google: a.k.a. FANG
In 2015, Facebook climbed 31%, Amazon was up 106%, Netflix skyrocketed by 144%, and Google parent company Alphabet rose 41%. Looking at the broader collection of large cap Internet stocks, the average stock returned 21%, while the average small cap Internet stocks declined 11%.
But not all large cap Internet stocks were strong performers this year. Twitter, Yahoo, Alibaba and Zillow didn’t have such great years. The biggest underperformers among large cap Internet stocks were Yahoo, Twitter and Alibaba, with Twitter repeating its pathetic stock price performance from 2014 this year.
Their sad performances weren’t enough to drag down large caps, however, as FANG boosted the whole large cap portion of the Internet sector to an average return of 21% and 13% at the media, reports RBC. Here’s a look at the performances of the 15 large cap Internet stocks the firm covers:
http://41.media.tumblr.com/23b6ca9247f05d905f0c5b1e8bc94ddf/tumblr_inline_o074yaxx8M1s8ylxw_500.png
Secular growth to continue in Retail, Advertising, Travel
Despite FANG’s searing outperformance in 2015, two stocks managed to make it onto RBC’s hot list again this year, and they are Google and Amazon. According to RBC analysts, the top three outperformers in their large cap Internet coverage universe were Netflix, Amazon and Expedia, which returned an average of 98% and contrasted sharply with 2014 as both Netflix and Amazon ended the year in the red.
For 2016, the RBC team likes Online Advertising, Retail and Travel, noting that their growth rates have been consistent and accelerated in some areas over the last few years. For example, Alphabet has posted between 16% and 21% growth in organic ad revenue over the last 11 quarters. Facebook has also posted consistent growth rates.
Looking at Retail, Amazon has seen Retail revenue growth of 17% to 24% for the last ten quarters, hitting a three-year high of 27% in the third quarter of this year. In Online Travel, Expedia and Priceline have also posted consistent growth rates over the last three years, with Expedia seeing rates between 23% and 30% over the last seven quarters.
Unit growth trends
When looking at units, RBC analysts argue in favor of Alibaba, Yelp, Netflix, LinkedIn, Expedia, Priceline, Amazon and Alphabet. They note that unit growth rates have been decelerating, but they were still mostly robust this past year in both large and small caps. In fact, some have even seen more than 20% growth year over year in key metrics.
http://40.media.tumblr.com/003cddb33a7600aa5f005d82d5aa40dc/tumblr_inline_o07500eJvO1s8ylxw_500.png
Over the last 23 quarters, only three companies have continued to see revenue growth of about 20% or more on a run rate of more than $10 billion, and they are Google, Amazon and Priceline. Although Google and Amazon did miss these numbers slightly late last year and early this year, their overall growth trends have remained “impressive,” the RBC analysts said because of their huge sizes.
ValueWalk
http://36.media.tumblr.com/84d7da3b816d214ebf586ab1babce998/tumblr_inline_o0750iZCHJ1s8ylxw_500.png
Allegati
- Registrato
- 12/2/08
- Messaggi
- 13.182
- Punti reazioni
- 353
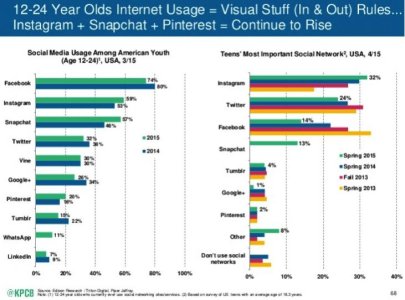
A proposito di internet, tramite link materiale sulla ventesima conferenza, relazione annuale di maggio 2015 presentata da Mary Meeker sui trend di internet.
Nel 1995 gli utenti internet erano lo 0,6% della popolazione mondiale .
Nel 2014, ci sono stati 2,8 miliardi di utenti Internet, pari al 39% della popolazione mondiale di 7,2 miliardi di persone.
Here's Mary Meeker's 20th annual Internet Trends report | VentureBeat | Business | by Harrison Weber && Dylan Tweney
https://www.domo.com/blog/2015/06/5-major-takeaways-from-mary-meekers-internet-trends-report/
https://www.slideshare.net/mobile/kleinerperkins/internet-trends-v1
28 maggio 2015 – Secondo la 10° edizione dello studio annuale Cisco® Visual Networking Index (VNI) Forecast, tra il 2014 e il 2019 il traffico IP (Internet Protocol) annuale triplicherà
....
Cisco prevede che il traffico IP globale raggiungerà i 168 exabyte al mese entro il 2019, rispetto ai 59,9 exabyte al mese registrati nel 2014. Nel 2019, il traffico che passerà sulle reti IP globali raggiungerà il valore di tutti gli "anni Internet" precedenti nel loro insieme (dal 1984 fino alla fine del 2013). Ci sarà un traffico IP caratterizzato dai seguenti trend:
Più utenti Internet – parallelamente alla crescita ed espansione delle reti fisse e mobili, molte più persone avranno accesso alla rete e a Internet. Nel 2014, ci sono stati 2,8 miliardi di utenti Internet, pari al 39% della popolazione mondiale di 7,2 miliardi di persone. Entro il 2019, ci saranno circa 3,9 miliardi di utenti Internet, che corrisponderanno al 51% della popolazione mondiale prevista di 7,6 miliardi di persone (Fonte: Population Division of the Dept. of Economic & Social Affairs of the United Nations).
Crescita del numero di dispositivi e connessioni – Con 24 miliardi di dispositivi connessi in rete previsti entro il 2019, rispetto ai 14 miliardi del 2014, le reti dei service provider devono essere pronte a connettere dispositivi più sofisticati. Tali dispositive includono tablet, smartphone, TV ultra-high definition (UHD- TV) abilitate al collegamento a Internet, oltre a connessioni M2M e dispositivi ‘wearable’ (smart watch, health monitor, ecc.). A livello globale, ci saranno 3,2 dispositivi/connessioni a testa, rispetto ai 2 a testa registrati nel 2014. Sarà necessario prevedere l’autenticazione di tutti questi dispositivi affinché possano accedere a reti via cavo o wireless cosa che richiederà reti più intelligenti, gestite e sicure. Per gestire il volume e la complessità di collegare i dispositivi di prossima generazione, i carrier devono già prevedere una strategia IPv6 completa. A livello globale, il 41% di tutti i dispositivi/connessioni entro il 2019 saranno abilitate all’IPv6-capabl, rispetto al 22% del 2014.
Il broadband fisso diventa più veloce – Globalmente, la media della velocità della connessione broadband raddoppierà dai 20.3 Mbps del 2014 a 42.5 Mbps nel 2019. Questo valore è cresciuto anno su anno del 26% da 16 Mbps nel 2013 a 20.3 Mbps nel 2014. Osservando il dato a livello regionale, l’Europa occidentale e l’Asia Pacifico continuano a mantenere il primato della velocità di banda delle connessioni fisse. America del Nord e altre regioni stanno aggiornando le proprie risorse di rete per consentire la fruizione di più contenuti e applicazioni ad elevato consumo di banda (come ad esempio il video UHD). Nel 2019, il 33% di tutte le connessioni fisse a banda larga sarà più veloce di 25 Mbps, rispetto al 29% di oggi (il dato sulla velocità di rete mobile è incluso nel 2015 VNI Mobile report di febbraio di quest’anno).
Nuovi servizi video avanzati – nel 2019 il video su IP rappresenterà l’80% dell’intero traffico IP, in crescita da 67% del 2014. L’evoluzione dei servizi video avanzati (come ad esempio l’UHD, lo spherical video e il video a 360 gradi) e le applicazioni video M2M creeranno una necessitàdi maggiore ampiezza di banda e scalabilità da parte dei service provider. Gli utenti residenziali professionali e mobile continueranno a richiedere servizi video avanzati per tutti i tipi di dispositivi connessi a Internet, rendendo fattori chiave di successo non solo la qualità, ma anche la convenienza economica, l’esperienza nella fruizione dei contenuti e il prezzo.
Mobility – Nel 2019, più del 14% del traffico IP mensile farà capo a connessioni cellulari, e il 53% del traffico IP mobile deriverà da connessioni Wi-Fi, facendo delle strategie mobili un elemento differenziante e monetizzabile ancora più importante per tutti i service provider.
Nel 2019 i dispositivi Wi-Fi e quelli mobile genereranno il 67% del traffico IP– così ripartiti: Wi-Fi: 53% e cellulari 14% – rispetto a un traffico su rete fissa che ammonterà al 33% del traffico complessivo.
Nel 2014, il traffico di rete fissa era il 54% del traffico IP, mentre il Wi-Fi contava per il 42% e il cellulare il 4%.
La crescita dell’Internet of Everything (IoE) e M2M – Il trend legato all’IoE sta mostrando una crescita tangibile dal momento che si prevede che le connessioni M2M triplicheranno nel corso dei prossimi cinque anni (in crescita a 10,5 miliardi entro il 2019). Ci sarà una significativa adozione di IoE in molti settori verticali (ad esempio agricoltura, sanità, manufacturing, retail, logistica e trasporti), oltre ad applicazioni di connected home (video sorveglianza, contatori intelligenti, controllo della temperatura e dell’illuminazione ecc.):
il segmento Connected Health consumer segnerà la più rapida crescita di connessioni M2M, pari a 8.6 volte (con un tasso CAGR del 54%) dal 2014 al 2019;
il segmento connected home nel 2019 rappresenterà circa la metà (48%) delle connessioni M2M.
il traffico annuale globale M2M su IP crescerà di 15 volte nello stesso periodo – da 308 petabyte nel 2014 (0.5% del traffico IP globale) a 4.6 exabyte nel 2019 (che rappresentano il 2.7% del traffico IP globale).
L’impatto del Gaming– Cisco prevede un notevole aumento del traffico di rete associato al download di giochi guidato dalla disponibilità di capacità di storage sulle console di gioco, un aumento del traffico in upstream dal cloud, e delle connessioni in fibra.
L’adozione di servizi avanzati – La musica online sarà il servizio a più rapida crescita con un tasso di crescita CAGR del 7.7% dal 2014-2019, registrando una crescita da 1.2 a 1.7 miliardi di utenti entro il 2019. I servizi mobile basati su localizzazione (LBS) saranno i servizi consumer a più rapida crescita con un CAGR del 27.5% nel quinquennio 2014-19, in crescita da 597 milioni di utenti nel 2014 a oltre 2 miliardi di utenti entro il 2019. I servizi di videoconferenza desktop e personal saranno il servizio Internet professionale a più rapida crescita con un tasso CAGR del 23.5% tra il 2014-2019, crescendo da 76 nel 2014 a 220 milioni di utenti nel 2019.
...
Tra il 2014 e il 2019 il traffico IP triplicherà, guidato dalla crescita degli accessi mobile e dalla richiesta di servizi video - Cisco Systems
Allegati
edoardo901
Nuovo Utente
- Registrato
- 22/1/16
- Messaggi
- 9
- Punti reazioni
- 0
Morgan Stanley Investment Funds Global Opportunity A cosa ne pensate?
Ciao,
da circa 4 mesi ho sottoscritto questo fondo con un PAC della durata di 5 anni.
Premetto che è stata la mia prima operazione finanziaria e che la scelta non è stata studiata molto ( so già ovviamente che è un errore) ma mi sono fatto guidare dai rendimenti avuti negli ultimi anni e dalla valutazione di morning star.
Cosa ne pensate di questo fondo?
So che è un fondo quasi a totalità azionarie e quindi anche elevato rischio. Questo sono disposto ad accettarlo.
Pensate possa essere valido per i prossimi 5 anni?
La maggior parte dei titoli che ha appartengono al settore tecnologico, non mi sembra male. Allo stesso tempo un po' mi "preoccupa" che abbia Facebook como titolo principale che ricopre il 9%.
Grazie
- Registrato
- 12/2/08
- Messaggi
- 13.182
- Punti reazioni
- 353
È un fondo con impostazione growth , che secondo le schede di pochi mesi fa investiva in alcune azioni che erano salite molto nel 2013-2015 , anche alcune azioni apparentemente care in base ad alcuni multipli, ma di società uniche, che secondo il gestore hanno punti di forza sostenibili nel tempo .
Sovrappesava azioni di settori tecnologici, internet e legate ai consumi discrezionali.
Per quest' anno le prospettive sono incerte.
Per gli investimenti azionari l' orizzonte temporale può essere di almeno 20 anni. Su archi temporali meno lunghi non è detto che si ottenga un risultato positivo al netto dell' inflazione e delle tasse.
http://www.finanzaonline.com/forum/8029907-post3.html
http://www.aaii.com/files/images/articles/9298-figure-1.jpg
- Registrato
- 12/2/08
- Messaggi
- 13.182
- Punti reazioni
- 353
H. Blodget ( che tra 1998 e 2000 era diventato famoso come analista finanziario del settore internet , prima per Oppenheimer poi per Merrill Lynch, prevedendo tra l' altro il rialzo delle azioni di Amazon.com quando l' azienda era ancora poco considerata dai più ) all' inizio di quest' anno sul sito di informazione di cui era stato co-fondatore , ha scritto un articolo in cui ha detto che, in base ad alcuni parametri valutativi , non ci sarebbe da stupirsi se il mercato azionario USA perdesse il 50% o più.
Pochi anni fa quando Facebook veniva collocata in borsa Blodget aveva scritto un articolo in cui esprimeva valutazioni piuttosto azzeccate sui livelli di prezzo a cui le azioni Facebook sarebbero state interessanti da acquistare, considerando i multipli di qualche altra società già quotata.
Henry Blodget
Jan. 4, 2016, 4:47 PM
No one likes to be the bearer of bad news, especially when it comes to stock prices.
But someone has to do it!
So here goes:
By many, many historically predictive valuation measures, stocks are overvalued to the tune of 75%-100%.
In the past, when stocks have been this overvalued, they have often "corrected" by crashing (1929, 1987, 2000, 2007, for example) . They have also sometimes corrected by moving sideways and down for a long, long time (1901-1920, 1966-1982, for example).
After long eras of over-valuation, like the period we have been in since the late 1990s (with the notable exceptions of the lows after the 2000 and 2007 crashes), stocks have also often transitioned into an era of undervaluation, often one that lasts for a decade or more.
In short, stocks are so expensive on historically predictive measures that the annual returns over the next decade are likely to net out to about 0% per year.
How we get there is anyone's guess.
But...
A stock-market crash of ~50% from the peak would not be a surprise. It would also not be the "worst-case scenario," by any means. The "worst-case scenario," which has actually been a common scenario over history, is that stocks would drop by, say 75% peak to trough.
Those are the facts.
Why isn't anyone talking about those facts?
Three reasons:
First, as mentioned, no one in the financial community likes to hear bad news or to be the bearer of bad news when it comes to stock prices. It's bad for business.
Second, valuation is nearly useless as a market-timing indicator.
Third, yes, there is a (probably small) chance that it's "different this time," and all the historically predictive valuation measures are out-dated and no longer predictive.
The third reason is the one that everyone who is bullish about stocks these days is implicitly or explicitly relying on: "It's different this time."
Just so you know, every time there is a long bull market like the one we've had, people come up with lots of reasons to explain why it's different this time. (And understandably so! Everyone wants the bull market to continue, and no one wants to miss further gains.) They did that in the late 1920s. They did that in the late 1990s. They did that in 2007. Usually, however, it isn't different this time, and normality reasserts itself with a vengeance.
As for timing... Unfortunately, even if historical valuation measures are still valid, and stocks are poised to have another lousy decade, today's valuations won't help you predict what the market will do over the next year or two.
And it's almost as painful to miss further market gains by turning cautious too early than it is to get obliterated in a crash. (Almost.)
So that's why almost everyone's still bullish.
But what today's valuations do tell us is that no one should be surprised if stocks crash 50% or more or are still trading around the current level in a decade.
Now you know!
(None of this means that you should sell your stocks, by the way. I own stocks, and I'm not selling. It just means that you should be mentally and financially prepared for a major drawdown. You should also be diversified.)
Here are some of the valuation details...
Stocks are wildly overvalued on historically predictive measures
According to several historically valid measures, stocks are now more expensive than they have been at any time in the past 130 years, with the exception of 1929 and 2000 (and we know what happened in those years).
For example, the chart below is from Yale professor Robert Shiller. It shows the cyclically adjusted price-earnings ratio of the S&P 500 for the past 130 years.
As you can see, the current PE ratio of at least 26 is miles above the long-term average of 15. In fact, it is higher than at any point in the 20th century, with the exception of the months that preceded the two biggest stock-market crashes.
http://static3.uk.businessinsider.c...54a148b45c1-855-586/shiller pe with rates.jpg
...
This one charts the collective value of all stocks to the size of the economy (GDP). It recently hit its second-highest level ever.
http://static4.uk.businessinsider.c...-669/screen shot 2015-12-12 at 8.21.11 am.png
ou can quibble with any of these measures. But, collectively, they all say the same thing: Stocks are very expensive.
But isn't it 'different this time'?
Every time stocks get expensive, some people argue "it's different this time."
This time, they say, stock valuations like today's are justified, and stock prices will just keep going up.
Usually, however, it's not different.
Eventually, stock prices revert to the mean, usually violently. That's why the words, "it's different this time" are described as the "four most-expensive words in the English language."
But, yes, it's possible that it's "different this time." Sometimes things do change, and investors clinging to old measures miss big gains before they realize their mistake.
It's possible, for example, that Shiller's PE ratio is no longer valid. Shiller's friend, Professor Jeremy Siegel from Wharton, thinks that several things have changed and that stocks are still undervalued.
It certainly seems possible that the future average of Shiller's PE ratio will be significantly higher than it has been in the past 130 years. But it would take a major change indeed for the average PE ratio to shift upward by, say, 50%.
While we're at it, please note something else in the Shiller chart above: Sometimes — as in the entire first 70 years of the past century — PEs (blue line) can be low even when interest rates (red line) are low. That's worth noting, because today you often hear bulls say that today's high PEs are justified by today's low-interest rates.
Even if this were true — even if history did not clearly show that you could have low PEs with low rates — this argument would not protect you from future losses, because today's low rates could eventually regress upward to normal. But it's just not true that low rates always mean high PEs.
And in case some of your bullish friends have convinced you that Shiller's PE analysis is irrelevant, check out the chart below.
It's from fund manager John Hussman. It shows six valuation measures in addition to the Shiller PE that have been highly predictive of future returns. The left scale shows the predicted 10-year return for stocks according to each valuation measure. The colored lines (except green) show the predicted return for each measure at any given time. The green line is the actual return over the 10 years from that point. (It ends 10 years ago.)
Today, the average expected return for the next 10 years is slightly positive — just under 2% a year. That's not horrible. But it's a far cry from the 10% long-term average.
http://static5.uk.businessinsider.c...754/screen shot 2014-02-19 at 10.13.47 am.png
In conclusion ...
Stocks are priced to deliver lousy returns over the next seven to 10 years. I would not be surprised to see the stock market drop sharply from this level, perhaps as much as 50% over a couple of years.
None of this means for sure that the market will crash or that you should sell stocks. (I own stocks, and I'm not selling them.) It does mean, however, that you should be mentally prepared for the possibility of a major pullback and lousy long-term returns.
Stocks could crash by at least 50% - Business Insider
Stocks are dangerously expensive - Business Insider
Henry Blodget talks about why he sold Business Insider - Fortune
https://translate.google.com/
Al 31/12/2015 MS Global Opportunity A Eur investiva negli Stati Uniti il 53,50% del Portafoglio e in base ai dati già comunicati, noti, le azioni che possedeva avevano multipli più elevati della media di categoria. Questo può anche significare che possedeva azioni di società che crescono più della media o con prospettive di medio/lungo termine superiori alla media. Ma se il mercato azionario USA recentemente aveva multipli medi elevati, il portafoglio di questo fondo certo non era da meno, anzi presentava alcune azioni tra quelle che rendono caro il mercato USA in base ad alcuni parametri.
Asset Allocation del Fondo |Primi 10 titoli in portafoglio |Morgan Stanley Investment Funds Global Opportunity A (EUR)|ISIN:LU0552385295
La prossima settimana verranno comunicati i risultati trimestrali e l' outlook di importanti società come Facebook, Amazon e altre ; bisognerà vedere come reagirà il mercato.
Before Apple, Facebook Report, You Need To Know This | Stock News & Stock Market Analysis - IBD
Ultima modifica:
- Registrato
- 12/2/08
- Messaggi
- 13.182
- Punti reazioni
- 353
Facebook , prima partecipazione di MS Global Opportunity al 31/12/2015 , ha comunicato risultati trimestrali superiori al consensus .
http://www.nytimes.com/2016/01/28/technology/facebook-earnings-zuckerberg.html?_r=0
...
For the fourth quarter, Facebook reported net income of $1.56 billion, or 54 cents per share, up from $701 million, or 25 cents a share reported a year ago.
Excluding some expenses, Facebook reported earnings of 79 cents per share, higher than the 68 cents a share projected by Wall Street analysts.
....
Facebook profit tops $1 billion - MarketWatch
FB sale del 12,5% circa in after hours.