Installa l'app
How to install the app on iOS
Follow along with the video below to see how to install our site as a web app on your home screen.
Nota: This feature may not be available in some browsers.
Stai usando un browser molto obsoleto. Puoi incorrere in problemi di visualizzazione di questo e altri siti oltre che in problemi di sicurezza. .
Dovresti aggiornarlo oppure usare usarne uno alternativo, moderno e sicuro.
Dovresti aggiornarlo oppure usare usarne uno alternativo, moderno e sicuro.
TER Teradyne Inc.
- Creatore Discussione proteone
- Data di inizio
Più opzioni
Chi ha risposto?
- Registrato
- 19/2/08
- Messaggi
- 20.659
- Punti reazioni
- 255
E TER in senso stretto non produce semiconduttori: è leader nella fornitura di apparecchiature automatiche per il collaudo di elettronica complessa nelle industrie dell’elettronica di consumo, automobilistica, informatica, delle telecomunicazioni, aerospaziale e della difesa. TER fornisce apparecchiature per testare i semiconduttori.
Nella trimestrale di Aprile aveva comunicato margini in netta crescita e il PEG ratio attualmente è di solo 0,87
Nella trimestrale di Aprile aveva comunicato margini in netta crescita e il PEG ratio attualmente è di solo 0,87
cervellofine
Volare libero
- Registrato
- 30/10/06
- Messaggi
- 6.558
- Punti reazioni
- 194
buon titolo ? close 4.67 +10% da analizzare graficamente
Bob71
Nuovo Utente
- Registrato
- 30/10/02
- Messaggi
- 2.467
- Punti reazioni
- 49
buon titolo ? close 4.67 +10% da analizzare graficamente
 la stavo giusto segnalando all'amico angio l'altro giorno
Allegati
cervellofine
Volare libero
- Registrato
- 30/10/06
- Messaggi
- 6.558
- Punti reazioni
- 194
Business
Teradyne, Inc., together with its subsidiaries, provides automatic test equipment products and services worldwide. It operates in two segments, Semiconductor Test and Systems Test Group. The Semiconductor Test segment designs, manufactures, and markets semiconductor test products and services. Its test systems are used for wafer level and device package testing. These chips are used in automotive, communications, consumer, computer, and electronic game applications. This segment provides its products to integrated device manufacturers (IDMs) that integrate the fabrication of silicon wafers into their business; Fabless' companies, which outsource the manufacturing of silicon wafers; Foundries' that cater to the processing and manufacturing of silicon wafers; and outsourced sub-assembly and test providers, which offer test and assembly services for the final packaged devices to both Fabless companies and IDMs. It also provides Magnum test platform that tests memory devices, such as flash memory and dynamic random access memory, which are used in electronic products, as well as offers ETS platform for use by semiconductor manufacturers and assembly and test subcontractors in the low pin count analog/mixed signal discrete markets. The Systems Test Group segment designs, develops, manufactures, and sells military/aerospace test instrumentation and systems, hard disk drive test systems, circuit-board test and inspection systems, and automotive diagnostic and test systems. It sells its products to the electronics manufacturers of cell phones, servers, computers, Internet switches, automobiles, and military avionics systems. The company was founded in 1960 and is based in North Reading, Massachusetts.
VALUATION MEASURES
Market Cap (intraday)5: 1.83B
Enterprise Value (Jul 15, 2010)3: 1.61B
Trailing P/E (ttm, intraday): 168.83
Forward P/E (fye Dec 31, 2011)1: 6.18
PEG Ratio (5 yr expected): 0.38
Price/Sales (ttm): 1.82
Price/Book (mrq): 2.53
Enterprise Value/Revenue (ttm)3: 1.57
Enterprise Value/EBITDA (ttm)3: 9.38
FINANCIAL HIGHLIGHTS
Fiscal Year
Fiscal Year Ends: Dec 31
Most Recent Quarter (mrq): Apr 4, 2010
Profitability
Profit Margin (ttm): 0.67%
Operating Margin (ttm): 6.40%
Management Effectiveness
Return on Assets (ttm): 3.41%
Return on Equity (ttm): 1.05%
Income Statement
Revenue (ttm): 1.03B
Revenue Per Share (ttm): 5.88
Qtrly Revenue Growth (yoy): 173.30%
Gross Profit (ttm): 311.63M
EBITDA (ttm): 171.82M
Net Income Avl to Common (ttm): 6.93M
Diluted EPS (ttm): 0.06
Qtrly Earnings Growth (yoy): N/A
Balance Sheet
Total Cash (mrq): 460.47M
Total Cash Per Share (mrq): 2.56
Total Debt (mrq): 144.58M
Total Debt/Equity (mrq): N/A
Current Ratio (mrq): 3.07
Book Value Per Share (mrq): 4.09
Cash Flow Statement
Operating Cash Flow (ttm): 213.59M
Levered Free Cash Flow (ttm): 172.11M
TRADING INFORMATION
Stock Price History
Beta: 1.75
52-Week Change3: 44.46%
S&P500 52-Week Change3: 17.44%
52-Week High (Apr 22, 2010)3: 13.37
52-Week Low (Jul 15, 2009)3: 7.12
50-Day Moving Average3: 10.62
200-Day Moving Average3: 10.83
Share Statistics
Avg Vol (3 month)3: 6,914,920
Avg Vol (10 day)3: 4,602,230
Shares Outstanding5: 180.24M
Float: 179.36M
% Held by Insiders1: 0.49%
% Held by Institutions1: 105.00%
Shares Short (as of Jun 15, 2010)3: 24.68M
Short Ratio (as of Jun 15, 2010)3: 3.60
Short % of Float (as of Jun 15, 2010)3: 16.40%
Shares Short (prior month)3: 25.51M
Dividends & Splits
Forward Annual Dividend Rate4: N/A
Forward Annual Dividend Yield4: N/A
Trailing Annual Dividend Yield3: N/A
Trailing Annual Dividend Yield3: N/A
5 Year Average Dividend Yield4: N/A
Payout Ratio4: N/A
Dividend Date3: N/A
Ex-Dividend Date4: N/A
Last Split Factor (new per old)2: 2:1
Last Split Date3: Sep 1, 1999
cervellofine
Volare libero
- Registrato
- 30/10/06
- Messaggi
- 6.558
- Punti reazioni
- 194
min e max crescenti
cervellofine
Volare libero
- Registrato
- 30/10/06
- Messaggi
- 6.558
- Punti reazioni
- 194
Teradyne, Inc. (TER) Q2 2010 Earnings Call Transcript July 29, 2010 10:00 am ET
Operator
Good morning. My name is Jasmine, and I will be your conference operator today. At this time, I would like to welcome everyone to the Q2 2010 earnings release conference call. (Operator instructions) I would now like to turn the call over to Mr. Andrew Blanchard, sir you may begin.
Andrew Blanchard
Thank you, Jasmine. Good morning, everyone and welcome to our discussion of Teradyne’s most recent financial results. I am joined this morning by our Chief Executive Officer, Mike Bradley; and, our Chief Financial Officer, Greg Beecher.
Following our opening remarks, we will provide details of our performance for the second quarter of 2010 as well as our outlook for the third quarter. First, I’d like to address several administrative issues. The press release containing our most recent financial results was sent out via business wire last evening. Copies are available on our website or by calling Teradyne’s corporate relations office at 978-370-2221.
This call is being simultaneously webcast at www.teradyne.com. Note that during this call, we are providing slides on the website that may be helpful to you in following the discussion. To view them simply access the investor page of the site and click on live webcast icon. In addition, replays of this call will be available via the investor’s page of teradyne.com about 24 hours after the call ends. The replays will be available along with the slides through August the 14th.
The matters that we discuss today will include forward-looking statements that involve risk factors that could cause Teradyne’s results to differ materially from management’s current expectations. We encourage you to review the Safe Harbor statement contained in the earnings release as well as our most recent SEC filings for a complete description. Additionally, those forward-looking statements are made as of today and we take no obligation to update them as a result of developments occurring after this call.
During today’s call, we will make reference to non-GAAP financial measures. We have posted additional information concerning these non-GAAP financial measures including reconciliation to the most directly comparable GAAP financial measure where available on our website. To view them, go to the investor page and click on GAAP to non-GAAP reconciliation link.
Also, you may want to note that between now and our next conference call, Teradyne will be participating in the Oppenheimer Annual Technology, Media & Telecommunications Conference on August 11 in Boston; and, Morgan Stanley Semiconductors and Semi-Cap Equipment Conference on August 25th in Chicago.
Now let’s get on with the rest of the agenda. First our CEO, Mike Bradley, will review the state of the company and the industry in the second quarter and will review our outlook for the third quarter. Then our CFO, Greg Beecher, will provide more details on our quarterly financial performance along with our guidance for the third quarter. We will then answer your questions. For scheduling purposes, you should note that we intend to end this call after one hour. Mike?
Mike Bradley
Good morning, everyone. Thank you for joining us today. We've continued to deliver some very good numbers this past quarter and have registered a solid first half of 2010. We’re obviously operating at a very strong SOC test up turn. We feel that our results this past quarter and the guidance for the third quarter reflect three important things. Number one significant share gains in our core business; number two, positive momentum in new markets; and, number three, a steady hand on costs. Together these three elements are delivering record profitability, very strong cash flow and a solid base for future growth.
I’ll have Greg go through the numbers in detail including some discussion on our model, our cash strategy, and how our supply line is performing. But let me expand for a few minutes on those items that I think are especially important.
First of all, our SOC test business is very strong, continuing to grow faster than the market, as evidenced by the fact that we're likely to account for about 50% of the total SOC market's revenues in the first half of this year. On a longer time frame, we’ve also shown steady gains. Since the 2005, 2006 period, we’ve grown our SOC share from about 34% up to about 41% last year. 60% of that growth came from our own Flex and J750 products and 40% from Eagle and Nextest growth. And we're on course to add three or four more share point this year, a very significant one-year move.
Our first half numbers would suggest an even larger share gain. But we believe some of these is due to the timing of segment buying patterns, which tend to be choppy, but which even out to their normalized levels over time. Our SOC test bookings in Q2 were up 1% topping the$430 million level for the second straight quarter. So for the first half, we’ve taken in over $870 million in total SOC orders and shipped about $670 million for our customers.
In addition, memory tests, both flash memory and DRAM, delivered another $27 million in orders this past quarter, putting us over $50 million for the year. So we're obviously operating in a strong SOC test market and are seeing signs of a strengthening memory test environment. But three things stand out in our numbers outside of this overall market growth.
First, our strength and power management microcontroller test and mobile wireless applications has meant that we're operating in three high growth segments of the SOC market. Second, our design end pace has continued with an additional 30 socket winds on top of the 32 we have in the first quarter. Now, this is about double our historical rate as the Eagle test product line including our newest product, the ETS88, is attacking the performance analog sector. The J750 and J750EX were advancing in the microcontroller and digital probe sectors and the Flex family is winning in the higher integration sectors. And third, we won additional DRAM test business and now have systems purchased for engineering and production of the latest DDR3 and GDDR5 silicon.
Obviously, the memory numbers are small relative to our SOC totals, but they are significant as they include strategic wins that should position us for revenue growth in coming quarters. Now our customers are bringing testers on line very rapidly. But despite that, utilization remains well above the 90% level. Our board repair data actually indicate that some systems previously decommissioned are back running in production. We've seen no backlog push-outs and continue to be asked for delivery acceleration.
On that front, we continue to ramp production aggressively with our supply-line partners. Semi-test unit shipments will increase 40% this coming quarter after a 35% increase in Q2. So we continue to press hard to meet customer demand.
Now on the systems test side of the ledger business is slower. A combination of slower paced defense spending and the expected lumpiness in hard disk drive ship schedules has the overall group below breakeven for the first half. But the promising news on the HDD front is a Neptune design end of a second customer, plus the expansion of our serve market to the addition of Enterprise Drive test capability to the platform. While a second customer isn’t likely to result in significant revenue in the short term, it does establish a broadened market base. And combined with the Enterprise Drive market coverage, should increase the top and bottom line contribution of that group in 2011 and beyond.
In past calls, we said that the hard disk drive test market could yield $40 million to $60 million annually at the top line. With the addition of enterprise test and an expanded customer base, we’re now shooting for double that revenue range over the next few years.
Now back to the semi-test side of the business, I should comment for a minute on the subject of the cycle, volatility and so on. My view comes from the input from a broad range of customers, all of whom operate in a very short lead-time world. They remain quite bullish on the short-term picture, yet all have their eyes on the world economy and consumer spending. So were all schizophrenics to some degree in this regard.
But as you know, we've variablized [ph] our manufacturing expenses and kept our fixed cost in check so we can be more focused in growing our market presence and winning key design ends for the future, independent of turns in the market. In total then, we're on course to post some even stronger results in the third quarter and we’re quite proud of the earnings leverage in our model and are pleased to actually show how it can perform.
So both the short and longer term pictures are promising. We have our best product line up in years, both organically and those added to our acquisitions. All of these are delivering as we planned and hoped they would. Our new memory offerings are indeed gaining traction despite a slower recovery in that sector and our position in the hard disk drive market is broadening, consistent with our goals.
All in all, I’m extremely proud of the extraordinary execution by our people this year inside our factory, at our design centers, at our customer sites and also within our suppliers’ factories. Our results reflect a success of those collaborative efforts.
Let me now turn it over to Greg for the financial perspective.
Greg Beecher
Thanks, Mike, and good morning, everyone. In addition to providing a detailed review of second quarter results and third quarter guidance, I’d also like to update you on our performance against model and on our cash plans.
Starting with a second quarter recap, we posted sales of $455 million, a non-GAAP operating profit rate of 32%, and EPS of $069. The EPS was $0.17 over the top end of our guidance due to very good delivery performance by our manufacturing and supply-line teams. This was our highest quarterly EPS since the third quarter of 2000 and our highest non-GAAP operating profit rate in history. These strong results were driven by a very efficient model, a broad strengthening of SOC tests market and further share gains.
We also had another solid booking quarter with SOC product orders up 4% from a very strong first quarter. So we're raising guidance again for this quarter. In the third quarter, we expect revenue of $419 million to $520 million with non-GAAP EPS of $0.75 to $0.83. This guidance has about 50% sequential quarterly growth in memory, off a low base of $21 million in sales and essentially no hard disk drive revenue. So there should be more in the tank further out to fuel both of these growth engines.
Before I get into some details on the second quarter and our guidance, I want to emphasize that our model is performing very well. You'll recall that we sized the model to earn model 15% profits when the SOC test market is about $2 billion a year. While we believe the SOC test market will average above $2 billion a year, we sized our cost structure at this level to ensure high leverage in a very efficient cost structure.
This sizing translates to about $275 million to $300 million in quarterly revenue to hit model profits, given our SOC test share and other businesses. The shorthand math on how our model works above the $275 million in quarterly sales is fairly straightforward. For every $25 million of additional sales over model sales, we add about a point in gross margin up to $350 million in quarterly sales and then the gross margin increases lessen. OpEx generally moves up or down quarterly based upon the level of current profitability as well as changes in our annual variable compensation estimates.
If we smooth this all out, we would generally add about $2 million of OpEx for variable compensation for each $25 million increase in sales over model. And these increases would also lessen past $250 million in quarterly sales. The only other factor to bear in mind is if the added volume is heavily skewed to hard disk drive or memory tests, both a gross margin drop through and the operating expense impact will of course be smaller.
Against any lens, you can see that our second quarter results measure up quite well against the model. We’ve also posted some slides on our web site to show how our model is affected by volume and mix. The only change of note from past illustrations is that mix will likely play a greater role with increased contribution expected from hard disk drive as we’ve expanded our serve market and broadened our customer-base.
We're clearly benefiting from the strengthening SOC test market. The demand we're seeing is particularly strong in the high growth mobile, smart power, and microcontroller segments where we offer compelling products.
On top of this, we’ve also gained new sockets in the first half of 2010 with about 60% of the share gains coming from Flex and J750 and about 40% from Eagle and Nextest. Our operations team did a great job ramping up the supply chain, which enabled us to keep lead time stable at 10 to 12 weeks on average in the second quarter.
Of course, the actual lead time varies more than the average depending upon the amount of visibility our customers is able to provide us. In that regard, we continue to work very closely with customers on forecasting future demand and we expect this will result in improved average lead times for forecast systems in the third quarter.
There is still a lot of material triage going on, but the list of critical parts is getting shorter. We’re quite pleased with our optimized manufacturing model and tight supply line collaboration, which has enabled us to increase semi-test unit shipments 2.5X over the last six months with some products increasing more than four-fold.
In the second quarter, systems test group lost money due to the anticipated decreases in hard disk drive and Mil/Aero demand. With that said, we expect better performance in the second half. In addition, we expect some hard drive disk acceptances and revenue recognition to occur in the fourth quarter even though we’re planning on shipping a number of these systems in the third quarter.
On a balance sheet, we ended the second quarter with gross cash of about $661 million, of which $90 million came from the second quarter operations after capital additions. Our net cash after deducting the $190 million face amount of convertible debt that is due in 2014 is $471 million.
We expect to add over $100 million in the third quarter to our gross and net cash balances. Our cash plans, after the debts of 2009, are understandably more conservative. In short, we plan to go through a full cycle and evaluate afterwards what plans, if any, makes sense with our cash reserves.
With the volatility in our business, plus with our current valuation being quite low relative to our earnings power, we need ample cash should we find an attractive acquisition. So for the foreseeable future, we will be in an accumulation phase. We also plan on paying off the $190 million principal amount of our convertible debt with cash in 2014.
Our carry forward net operating losses total about $280 million and we have federal tax credits of about $55 million. With the mix of income expected in 2010 by country, we expect our 2010 tax rate to be closer to 8% than our earlier 10% estimate. For modeling, in the future we’d expect an 8% to 10% rate through at least 2011.
Now, moving to the second quarter results, the top line of $455 million was up $125 million from the first quarter; semi-test was $413 million, up $123 million; and systems test group was $42 million, up $2 million. Semi-test product shipments increased 49% from a quarter ago and nine-fold from a trough in 2009. Then the $455 million service revenue was $64 million, up $2 million from a quarter ago. Semi-test service revenue was $48 million. Total company product terms business was 28% versus 37% a quarter ago. Semi-test product terms business was 28% versus 39% a quarter ago. Memory revenue was $21 million in the quarter, up from $16 million sequentially.
Moving down to P&L, gross margins increased from 52.6% in the first quarter to $55.9% in the second quarter due to higher volume. We also had favorable mix overall. R&D expenses were $50.4 million or 11.1% of sales compared to $49.1 million or 14.9% of sales in the first quarter. SG&A expenses were $58.3 million or 12.8% of sales compared to $55.9 million or 17% of sales in the first quarter.
Operating expenses in total of $108.7 million were up $3.8 million from the first quarter due to variable compensation. On a year-over-year basis, operating expenses were up $23 million, of which $18 million is variable compensation and $5 million is from the restoration of temporary pay cuts. I should add that revenues were up $285 million over the same period.
We've obviously kept a very firm hand on fixed cost. Rest assured that we'll also keep a keen eye on long term growth which may, at some point, require some added investments. Our net non-GAAP interest and other expense was $2.3 million. Taxes were $9.5 million in the quarter. Our headcount total is about 2,900.
In the second quarter, semiconductor sales were 91% of the total. System test group was 9%. Our book-to-bill ratio for the second quarter was 1.13 for the overall company, 1.13 for semiconductor tests, and 1.11 for the systems test group. OSATs made up 36% of our semi-test bookings in both the first and second quarter. In two to three past cycles, OSATs got above the 50% quarterly bookings mark for at least one quarter.
At the end of the quarter, our backlog stood at $634 million, of which 92% is scheduled to ship within the next six months. Cash flow from operations totaled approximately $90 million after deducting capital additions, depreciation and amortization. For the second quarter, was $32 million including $7 million of stock-based compensation, $7 million for acquired intangible asset amortization, and $2.6 million for amortization of the GAAP imputed debt discount.
As noted in the press release, sales for the third quarter are expected to be between $490 million and $520 million, and the non-GAAP EPS range is $0.75 to $0.83 on 200 million diluted shares. I should add that the guidance excludes the amortization of acquired intangibles and the non-cash imputed interest on the convertible debt. Our GAAP EPS range is $0.60 to $0.67.
Now moving to the P&L percentages in the third quarter, the operating profit rate at the midpoint of our third quarter guidance should be about 33%, which would be a new record eclipsing the second quarter. We expect gross margins to be about 56%, R&D should be about 10%, and SG&A should be about 12% to 13%. Non-GAAP net interest expense is expected to be about $2.3 million and a tax provision should be about $12 million.
In summary, our product offerings are in great demand. Our supply chain is delivering and our people are executing very well. And finally, while we're keeping a steady hand on fixed cost, we’re also keenly focused on our long term growth plan.
.......
http://seekingalpha.com/article/217580-teradyne-inc-q2-2010-earnings-call-transcript?source=yahoo
- Registrato
- 19/2/08
- Messaggi
- 20.659
- Punti reazioni
- 255
November 23rd, 2010
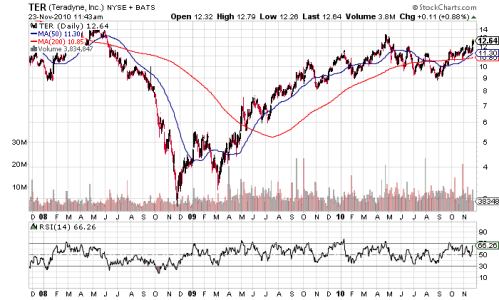
Equities research analysts at Citigroup, Inc upgraded shares of Teradyne (NYSE: TER) from a “hold” rating to a “buy” rating in a research note to investors on Monday, with a price target of $17.00.
Citigroup, Inc (NYSE: C) Upgrades Teradyne (NYSE: TER) to
.
Equities research analysts at Citigroup, Inc upgraded shares of Teradyne (NYSE: TER) from a “hold” rating to a “buy” rating in a research note to investors on Monday, with a price target of $17.00.
Citigroup, Inc (NYSE: C) Upgrades Teradyne (NYSE: TER) to
.
Allegati
cervellofine
Volare libero
- Registrato
- 30/10/06
- Messaggi
- 6.558
- Punti reazioni
- 194
.
gap up, max 14.83
gap up, max 14.83
cervellofine
Volare libero
- Registrato
- 30/10/06
- Messaggi
- 6.558
- Punti reazioni
- 194
.
16,4
16,4
Logan
Cieli blu sui Pigs
- Registrato
- 16/7/05
- Messaggi
- 17.710
- Punti reazioni
- 626
Teradyne Inc. (TER)
Teradyne, Inc., together with its subsidiaries, provides automatic test equipment products and services worldwide.
Teradyne has a very low debt (total debt to equity is only 0.10) and its price to free cash flow for the trailing 12 months is very low at 9.24. The trailing P/E is very low at 9.63 and the forward P/E is also very low at 9.63 and the PEG ratio is also very low at 0.75. The average annual earnings growth estimates for the next 5 years is 12.90%. For the third quarter, Teradyne beat expectations on revenues and beat expectations on earnings per share. Teradyne reported revenue of $463.4 million better than the analysts' estimates of $439.5 million, the reported sales were 35% higher than the prior-year quarter's $344.4 million. EPS came in at $0.53 and beat analysts' average earnings estimates of $0.45 per share. GAAP EPS of $0.39 for Q3 were 56% higher than the prior-year quarter's $0.25 per share. The company is trading 15% below its 52-week high, and has 28% upside potential based on the consensus mean target price of $19.62. TER stock seems to be a good investment right now.
5 Large Cap Growth Stocks To Beat The Market - Seeking Alpha