FTSEMIB e altri Indici

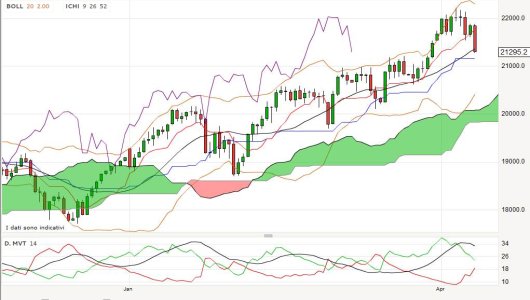
FTSEMIB – 08/04/2014 22:15:23 – CROC & Cicli

Si è formato un nuovo ZPE CROC (Zero Point Energy) a 22210 che potrebbe essere il massimo trimestrale…
ora la zona 21900 fondamentale… se non viene oltrepassata confermerebbe l’inversione di medio periodo.

CROC X1 – Supporti / Resistenze
R3 = 22.066,33
R2 = 21.896,11
R1 = 21.882,72
PIVOT = 21.531,22
S1 = 21.179,71
S2 = 20.155,96
S3 = 19.739,50


nel breve i cicli indicano ancora debolezza…

 
IVMIB 30 - Indice Volatilità FTSE MIB IVI 30 Days – Chiusura 08/04/14

Rotta la resistenza a 21,10

prepararsi a scendere anche domani sul FTSEMIB

 
S&P500 Index – ADX / ADM – TS – Livelli Intraday per il 09/04/14

Average Daily Moment – 30 Days – Intraday Levels
entrata su close candela oraria… se superato il livello indicato


LONG se > 1.859,20
TP1= 1.867,06
TP2= 1.875,79
TP3= 1.893,24
SL= 1.844,72

SHORT se < 1.844,72
TP1= 1.836,86
TP2= 1.828,13
TP3= 1.810,68
SL= 1.859,20

Invece per il Future Jun'14 - TF 1H

SHORT se < 1.838,21
TP1= 1.830,35
TP2= 1.821,62
TP3= 1.804,17
SL= 1.852,69

LONG se > 1.852,69
TP1= 1.860,55
TP2= 1.869,28
TP3= 1.869,28
SL= 1.886,73
 
FTSEMIB – Chiusura - 09/04/2014

Il FTSEMIB X4-TS è sempre LONG , Flat & Reverse leggibili sul grafico


BTP Future – Long Term – Chiusura – 09/04/2014

Il BTP Future – Long Term – X4-TS è sempre LONG Stop & Reverse leggibili sul grafico


EUROSTOXX 50 – Chiusura - 09/04/2014

L’ EUROSTOXX 50 X4-TS è sempre LONG , Flat & Reverse leggibili sul grafico

 
S&P500 Index – Chiusura - 09/04/2014

L’ S&P500 Index X4-TS è entrato FLAT , Entry Long/Short leggibili sul grafico

 
DOWJONES – Chiusura - 09/04/2014

Il DOWJONES X4-TS è entrato FLAT , Entry Long/Short leggibili sul grafico

 
FTSEMIB – ADX / ADM – TS – Livelli Intraday per il 10/04/2014

Average Daily Moment – Intraday Levels
entrata su close candela oraria… se superato il livello indicato

 
EUROSTOXX 50 – ADX / ADM – TS – Livelli Intraday per il 10/04/2014

Average Daily Moment – Intraday Levels
entrata su close candela oraria… se superato il livello indicato


S&P500 Index – ADX / ADM – TS – Livelli Intraday per il 10/04/2014

Average Daily Moment – 30 Days – Intraday Levels
entrata su close candela oraria… se superato il livello indicato


LONG se > 1.879,54
TP1= 1.887,51
TP2= 1.896,37
TP3= 1.914,10
SL= 1.864,82

SHORT se < 1.864,82
TP1= 1.856,85
TP2= 1.847,99
TP3= 1.830,26
SL= 1.879,54

sul SPX Future Jun'14 - TF 1H
SHORT se < 1.859,09
TP1= 1.851,12
TP2= 1.842,26
TP3= 1.824,53
SL= 1.873,81

LONG se > 1.873,81
TP1= 1.881,78
TP2= 1.890,64
TP3= 1.890,64
SL= 1.908,37
 
FTSEMIB – Chiusura - 10/04/2014

Il FTSEMIB X4-TS è entrato FLAT , Entry Long/Short leggibili sul grafico

 
rotti anche i 21300
 

Allegati

  • Italy 40 Future Grafico - Mozilla Firefox_2014-04-10_20-56-23.jpg
    Italy 40 Future Grafico - Mozilla Firefox_2014-04-10_20-56-23.jpg
    72,5 KB · Visite: 22

FTSEMIB – ADX / ADM – TS – Livelli Intraday per l’11/04/2014


Average Daily Moment – Intraday Levels
entrata su close candela oraria… se superato il livello indicato


TAVOLA SMERALDINA v.2.1 – Indici – del 10/04/2014 23:53:52

 
S&P500 Index – Chiusura - 10/04/2014

L’ S&P500 Index X4-TS è ri-entrato SHORT , Flat & Reverse leggibili sul grafico

confermando un Testa&Spalle Ribassista con target in zona 1790

 
Ultima modifica:
S&P500 Index – ADX / ADM – TS – Livelli Intraday per l’ 11/04/2014

Average Daily Moment – 30 Days – Intraday Levels
entrata su close candela oraria… se superato il livello indicato

 
FTSEMIB – ADX / ADM – TS – Livelli Intraday per l’ 11/04/2014


Average Daily Moment – Intraday Levels
entrata su close candela oraria… se superato il livello indicato


LONG se > 21.592,49
TP1= 21.738,10
TP2= 21.899,89
TP3= 22.223,46
SL= 21.265,69

SHORT se < 21.265,69
TP1= 21.120,08
TP2= 20.958,29
TP3= 20.634,72
SL= 21.592,49
 
Indietro