Installa l'app
How to install the app on iOS
Follow along with the video below to see how to install our site as a web app on your home screen.
Nota: This feature may not be available in some browsers.
Stai usando un browser molto obsoleto. Puoi incorrere in problemi di visualizzazione di questo e altri siti oltre che in problemi di sicurezza. .
Dovresti aggiornarlo oppure usare usarne uno alternativo, moderno e sicuro.
Dovresti aggiornarlo oppure usare usarne uno alternativo, moderno e sicuro.
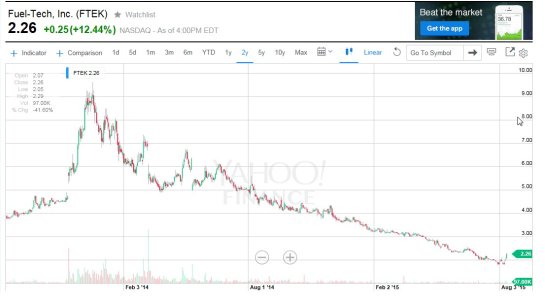
Fuel-Tech, Inc. (FTEK)
- Creatore Discussione Clau
- Data di inizio
Più opzioni
Chi ha risposto?Clau
Nuovo Utente
- Registrato
- 10/11/99
- Messaggi
- 5.115
- Punti reazioni
- 139
Key Statistics Get Key Statistics for:
Data provided by Capital IQ, except where noted.
Valuation Measures
Market Cap (intraday)5: 178.21M
Enterprise Value (Nov 24, 2010)3: 144.93M
Trailing P/E (ttm, intraday): 188.72
Forward P/E (fye Dec 31, 2011)1: 32.00
PEG Ratio (5 yr expected)1: 6.73
Price/Sales (ttm): 2.21
Price/Book (mrq): 2.01
Enterprise Value/Revenue (ttm)3: 1.92
Enterprise Value/EBITDA (ttm)3: 24.65
Financial Highlights
Fiscal Year
Fiscal Year Ends: Dec 31
Most Recent Quarter (mrq): Sep 30, 2010
Profitability
Profit Margin (ttm): 1.26%
Operating Margin (ttm): 2.11%
Management Effectiveness
Return on Assets (ttm): 1.04%
Return on Equity (ttm): 1.20%
Income Statement
Revenue (ttm): 75.48M
Revenue Per Share (ttm): 3.12
Qtrly Revenue Growth (yoy): 23.10%
Gross Profit (ttm): 28.95M
EBITDA (ttm): 5.88M
Net Income Avl to Common (ttm): 954.00K
Diluted EPS (ttm): 0.04
Qtrly Earnings Growth (yoy): N/A
Balance Sheet
Total Cash (mrq): 23.90M
Total Cash Per Share (mrq): 0.99
Total Debt (mrq): 2.24M
Total Debt/Equity (mrq): 2.71
Current Ratio (mrq): 3.42
Book Value Per Share (mrq): 3.42
Cash Flow Statement
Operating Cash Flow (ttm): 10.68M
Levered Free Cash Flow (ttm): 10.71M
View Financials
Income Statement - Balance Sheet - Cash Flow
Trading Information
Stock Price History
Beta: 1.40
52-Week Change3: -25.14%
S&P500 52-Week Change3: 6.31%
52-Week High (Nov 25, 2009)3: 9.80
52-Week Low (May 25, 2010)3: 5.15
50-Day Moving Average3: 6.37
200-Day Moving Average3: 6.18
Share Statistics
Avg Vol (3 month)3: 93,694
Avg Vol (10 day)3: 83,329
Shares Outstanding5: 24.21M
Float: 17.80M
% Held by Insiders6: 29.71%
% Held by Institutions6: 36.20%
Shares Short (as of Oct 29, 2010)3: 1.07M
Short Ratio (as of Oct 29, 2010)3: 13.50
Short % of Float (as of Oct 29, 2010)3: 6.00%
Shares Short (prior month)3: 1.13M
Italia 2.0
Nuovo Utente
- Registrato
- 23/4/12
- Messaggi
- 320
- Punti reazioni
- 10
Contratto sostanzioso in Cile che vale 1/3 della capitalizzazione....
Trasparente
Nuovo Utente
- Registrato
- 17/9/03
- Messaggi
- 110.202
- Punti reazioni
- 1.760
ora a 4,32
potrebbe valere un' entrata...
potrebbe valere un' entrata...
Sal.Vi
❖ Sa!Vi World Wide ❖
- Registrato
- 21/9/08
- Messaggi
- 8.422
- Punti reazioni
- 528
2❤12&More(Frattali.Frattaglie.Fritt ate.F ranchige.Franchi.Futures.Féssy)
 F T E K
Fuel Tech, Inc. (Fuel Tech), incorporated in 1987, is an integrated company, which uses a range of advanced technologies to provide boiler optimization, improvement and air pollution reduction and control solutions to utility and industrial customers globally. Fuel Tech’s focuses on the global marketing of its nitrogen oxide (NOx) reduction and FUEL CHEM processes. The air pollution control (APC) technology segment reduces NOx emissions in flue gas from boilers, incinerators, furnaces and other stationary combustion sources by utilizing combustion optimization techniques and low NOx and ultra low NOx Burners; NOxOUT and high energy reagent technology (HERT) SNCR systems; systems that incorporate CASCADE, ULTRA and NOxOUT-SCR processes; and ammonia injection grid (AIG) and the graduated straightening grid (GSG) technologies. The FUEL CHEM technology segment improves the efficiency, reliability and environmental status of combustion units by controlling slagging, fouling and corrosion, as well as the formation of sulfur trioxide, ammonium bisulfate, particulate matter (PM2.5), carbon dioxide, NOx and unburned carbon in fly ash through the addition of chemicals into the fuel or through targeted in-furnace injection (TIFI) programs.
Air Pollution Control
Fuel Tech’s NOx reduction technologies are installed globally on over 640 combustion units, including utility, industrial and municipal solid waste applications. The products include customized NOx control systems and patented urea-to-ammonia conversion technology, which could provide safe reagent for use in selective catalytic reduction (SCR) systems.
Low NOx Burners and Ultra Low NOx Burners are available for coal-, oil-, and gas-fired industrial and utility units. Each system application is specifically designed to maximize NOx reduction. Computational Fluid Dynamics combustion modeling is used to validate the design prior to fabrication of equipment. NOx reductions can range from 40%-60% depending on the fuel type. Over-Fire Air systems stage combustion for improved NOx reduction. Additional NOx reductions, beyond Low NOx Burners, of 35%-50%, are possible on different boiler configurations on a range of fuel types. Fuel Tech’s NOxOUT and HERT SNCR processes use non-hazardous urea as the reagent rather than ammonia.
Fuel Tech’s advanced selective catalytic reduction (ASCR) systems include include LNB, OFA, and SNCR components, along with a downsized SCR catalyst, ammonia injection grid (AIG), and graduated straightening grid (GSG) systems to provide up to 90% NOx reduction. The CASCADE and NOxOUT-SCR processes are basic types of ASCR systems, which use just SNCR and SCR catalyst components.
Fuel Tech’s ULTRA process is designed to convert urea to ammonia safely and economically for use as a reagent in the SCR process for NOx reduction. Fuel Tech sells flue gas conditioning systems incorporating FGC Corporation technology for utility applications in all geographies outside the United States and Canada. Flue gas conditioning systems improve the efficiency of particulate collectors, including electrostatic precipitators (ESPs) and fabric filters.
Fuel Tech provides process design optimization, performance testing and improvement, and catalyst selection services for SCR systems on coal-fired boilers. In addition, other related services, including start-ups, maintenance support and general consulting services for SCR systems, as well as ammonia injection grid design and tuning, to help optimize catalyst performance and catalyst management services to help optimize catalyst life, are offered to customers worldwide. Fuel Tech also specializes in both physical experimental models, which involve construction of scale models through which fluids are tested, and computational fluid dynamics models, which simulate fluid flow by generating a virtual replication of real-world geometry and operating inputs. Fuel Tech designs flow corrective devices, such as turning vanes, ash screens, static mixers and graduated straightening grid (GSG). Fuel Tech’s models help clients optimize performance in flow critical equipment, such as selective catalytic reactors in SCR systems.
The Company competes with Alstom, Foster Wheeler Corporation, The Babcock & Wilcox Company, Combustion Components Associates, Inc., Siemens, Babcock Power, Inc., Hitachi and Peerless Manufacturing Company in this segment.
FUEL CHEM
The FUEL CHEM technology segment revolves around the application of specialty chemicals to improve the efficiency, reliability and environmental status of plants operating in the electric utility, industrial, pulp and paper, waste-to-energy, university and district heating markets. FUEL CHEM programs are in place on over 95 combustion units, treating a range of solid and liquid fuels, including coal, heavy oil, biomass and municipal waste.
Central to the FUEL CHEM approach is the introduction of chemical reagents, such as magnesium hydroxide, to combustion units via in-body fuel application (pre-combustion) or via direct injection (post-combustion) utilizing Fuel Tech’s TIFI technology. By attacking performance-hindering problems, such as slagging, fouling and corrosion, as well as the formation of sulfur trioxide (SO3), ammonium bisulfate (ABS), PM2.5, carbon dioxide (CO2), NOx and unburned carbon in fly ash, the Company’s programs offer numerous operational, financial and environmental benefits to owners of boilers, furnaces and other combustion units. The principal markets for this product line are electric power plants burning coals with slag-forming constituents such as sodium, iron and high levels of sulfur. Sodium is typically found in the Powder River Basin (PRB) coals of Wyoming and Montana.
The Company competes with GE Infrastructure, Ashland Inc. and Environmental Energy Services, Inc.


I hope at least minimally useful. In case of interest (€uribor free, but spread for ever) ►►►►►►►.
☻/♬♪ ❖ GLOBO.pk Alert 2.O: $tay Th0NN0 ... 0PhRà !!! ❖ P▲ℕ❣☪ €MP¥R€ ❖ $@❣♆¥ DISCLAIMER, Ⓘℳ☢ & Manthra
/▌
/ \
Ⓘℳ☢ ℬɣ $@❣♆¥ ►►♥®█║▌│││█║℠™║▌║▌▌║█©❤◀◀
₭€$AⅅⅅhAPhA'pe'₭AℳℙA' ℬunda-ℬunda €MP¥R€ ❣❣❣
Fuel Tech, Inc. (Fuel Tech), incorporated in 1987, is an integrated company, which uses a range of advanced technologies to provide boiler optimization, improvement and air pollution reduction and control solutions to utility and industrial customers globally. Fuel Tech’s focuses on the global marketing of its nitrogen oxide (NOx) reduction and FUEL CHEM processes. The air pollution control (APC) technology segment reduces NOx emissions in flue gas from boilers, incinerators, furnaces and other stationary combustion sources by utilizing combustion optimization techniques and low NOx and ultra low NOx Burners; NOxOUT and high energy reagent technology (HERT) SNCR systems; systems that incorporate CASCADE, ULTRA and NOxOUT-SCR processes; and ammonia injection grid (AIG) and the graduated straightening grid (GSG) technologies. The FUEL CHEM technology segment improves the efficiency, reliability and environmental status of combustion units by controlling slagging, fouling and corrosion, as well as the formation of sulfur trioxide, ammonium bisulfate, particulate matter (PM2.5), carbon dioxide, NOx and unburned carbon in fly ash through the addition of chemicals into the fuel or through targeted in-furnace injection (TIFI) programs.
Air Pollution Control
Fuel Tech’s NOx reduction technologies are installed globally on over 640 combustion units, including utility, industrial and municipal solid waste applications. The products include customized NOx control systems and patented urea-to-ammonia conversion technology, which could provide safe reagent for use in selective catalytic reduction (SCR) systems.
Low NOx Burners and Ultra Low NOx Burners are available for coal-, oil-, and gas-fired industrial and utility units. Each system application is specifically designed to maximize NOx reduction. Computational Fluid Dynamics combustion modeling is used to validate the design prior to fabrication of equipment. NOx reductions can range from 40%-60% depending on the fuel type. Over-Fire Air systems stage combustion for improved NOx reduction. Additional NOx reductions, beyond Low NOx Burners, of 35%-50%, are possible on different boiler configurations on a range of fuel types. Fuel Tech’s NOxOUT and HERT SNCR processes use non-hazardous urea as the reagent rather than ammonia.
Fuel Tech’s advanced selective catalytic reduction (ASCR) systems include include LNB, OFA, and SNCR components, along with a downsized SCR catalyst, ammonia injection grid (AIG), and graduated straightening grid (GSG) systems to provide up to 90% NOx reduction. The CASCADE and NOxOUT-SCR processes are basic types of ASCR systems, which use just SNCR and SCR catalyst components.
Fuel Tech’s ULTRA process is designed to convert urea to ammonia safely and economically for use as a reagent in the SCR process for NOx reduction. Fuel Tech sells flue gas conditioning systems incorporating FGC Corporation technology for utility applications in all geographies outside the United States and Canada. Flue gas conditioning systems improve the efficiency of particulate collectors, including electrostatic precipitators (ESPs) and fabric filters.
Fuel Tech provides process design optimization, performance testing and improvement, and catalyst selection services for SCR systems on coal-fired boilers. In addition, other related services, including start-ups, maintenance support and general consulting services for SCR systems, as well as ammonia injection grid design and tuning, to help optimize catalyst performance and catalyst management services to help optimize catalyst life, are offered to customers worldwide. Fuel Tech also specializes in both physical experimental models, which involve construction of scale models through which fluids are tested, and computational fluid dynamics models, which simulate fluid flow by generating a virtual replication of real-world geometry and operating inputs. Fuel Tech designs flow corrective devices, such as turning vanes, ash screens, static mixers and graduated straightening grid (GSG). Fuel Tech’s models help clients optimize performance in flow critical equipment, such as selective catalytic reactors in SCR systems.
The Company competes with Alstom, Foster Wheeler Corporation, The Babcock & Wilcox Company, Combustion Components Associates, Inc., Siemens, Babcock Power, Inc., Hitachi and Peerless Manufacturing Company in this segment.
FUEL CHEM
The FUEL CHEM technology segment revolves around the application of specialty chemicals to improve the efficiency, reliability and environmental status of plants operating in the electric utility, industrial, pulp and paper, waste-to-energy, university and district heating markets. FUEL CHEM programs are in place on over 95 combustion units, treating a range of solid and liquid fuels, including coal, heavy oil, biomass and municipal waste.
Central to the FUEL CHEM approach is the introduction of chemical reagents, such as magnesium hydroxide, to combustion units via in-body fuel application (pre-combustion) or via direct injection (post-combustion) utilizing Fuel Tech’s TIFI technology. By attacking performance-hindering problems, such as slagging, fouling and corrosion, as well as the formation of sulfur trioxide (SO3), ammonium bisulfate (ABS), PM2.5, carbon dioxide (CO2), NOx and unburned carbon in fly ash, the Company’s programs offer numerous operational, financial and environmental benefits to owners of boilers, furnaces and other combustion units. The principal markets for this product line are electric power plants burning coals with slag-forming constituents such as sodium, iron and high levels of sulfur. Sodium is typically found in the Powder River Basin (PRB) coals of Wyoming and Montana.
The Company competes with GE Infrastructure, Ashland Inc. and Environmental Energy Services, Inc.
I hope at least minimally useful. In case of interest (€uribor free, but spread for ever) ►►►►►►►.
☻/♬♪ ❖ GLOBO.pk Alert 2.O: $tay Th0NN0 ... 0PhRà !!! ❖ P▲ℕ❣☪ €MP¥R€ ❖ $@❣♆¥ DISCLAIMER, Ⓘℳ☢ & Manthra
/▌
/ \
Ⓘℳ☢ ℬɣ $@❣♆¥ ►►♥®█║▌│││█║℠™║▌║▌▌║█©❤◀◀
₭€$AⅅⅅhAPhA'pe'₭AℳℙA' ℬunda-ℬunda €MP¥R€ ❣❣❣
cervellofine
Volare libero
- Registrato
- 30/10/06
- Messaggi
- 6.558
- Punti reazioni
- 194
Agg. fond.
Key Statistics
Valuation Measures
Market Cap (intraday)5: 100.68M
Enterprise Value (Oct 21, 2013)3: 79.92M
Trailing P/E (ttm, intraday): 45.45
Forward P/E (fye Dec 31, 2014)1: 26.47
PEG Ratio (5 yr expected)1: 2.51
Price/Sales (ttm): 0.99
Price/Book (mrq): 1.20
Enterprise Value/Revenue (ttm)3: 0.78
Enterprise Value/EBITDA (ttm)6: 10.30
Financial Highlights
Fiscal Year
Fiscal Year Ends: Dec 31
Most Recent Quarter (mrq): Jun 30, 2013
Profitability
Profit Margin (ttm): 2.31%
Operating Margin (ttm): 4.55%
Management Effectiveness
Return on Assets (ttm): 2.75%
Return on Equity (ttm): 2.81%
Income Statement
Revenue (ttm): 103.10M
Revenue Per Share (ttm): 4.66
Qtrly Revenue Growth (yoy): 39.10%
Gross Profit (ttm): 40.74M
EBITDA (ttm)6: 7.76M
Net Income Avl to Common (ttm): 2.38M
Diluted EPS (ttm): 0.10
Qtrly Earnings Growth (yoy): 1,717.60%
Balance Sheet
Total Cash (mrq): 23.14M
Total Cash Per Share (mrq): 1.03
Total Debt (mrq): 807.00K
Total Debt/Equity (mrq): 0.94
Current Ratio (mrq): 2.56
Book Value Per Share (mrq): 3.82
Cash Flow Statement
Operating Cash Flow (ttm): 2.88M
Levered Free Cash Flow (ttm): 799.50K
Trading Information
Stock Price History
Beta: 0.59
52-Week Change3: 16.88%
S&P500 52-Week Change3: 21.67%
52-Week High (Feb 11, 2013)3: 5.20
52-Week Low (Nov 15, 2012)3: 3.45
50-Day Moving Average3: 4.27
200-Day Moving Average3: 3.99
Share Statistics
Avg Vol (3 month)3: 81,351
Avg Vol (10 day)3: 42,363
Shares Outstanding5: 22.37M
Float: 15.71M
% Held by Insiders1: 28.07%
% Held by Institutions1: 28.00%
Shares Short (as of Sep 30, 2013)3: 343.72K
Short Ratio (as of Sep 30, 2013)3: 3.50
Short % of Float (as of Sep 30, 2013)3: 2.20%
Shares Short (prior month)3: 321.95K
Dividends & Splits
Forward Annual Dividend Rate4: N/A
Forward Annual Dividend Yield4: N/A
Trailing Annual Dividend Yield3: N/A
Trailing Annual Dividend Yield3: N/A
5 Year Average Dividend Yield4: N/A
Payout Ratio4: N/A
Dividend Date3: N/A
Ex-Dividend Date4: N/A
Last Split Factor (new per old)2: N/A
Last Split Date3: N/A
...........
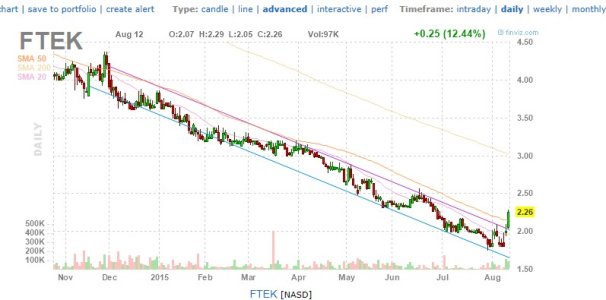
Fuel-Tech, Inc. (FTEK) -NasdaqGS
4.51 Down 0.06(1.31%) 12:27PM EDT - Nasdaq Real Time Price
Date prox earnings 4 Nov
FTEK Key Statistics | Fuel Tech, Inc. Stock - Yahoo! Finance
Sono ben gradite spiegazioni e commenti, dello stock..graficamente staziona sulle medie mobili lente in daily e sma 200.. pare arrancare necessario ulteriore propellente imho..
Key Statistics
Valuation Measures
Market Cap (intraday)5: 100.68M
Enterprise Value (Oct 21, 2013)3: 79.92M
Trailing P/E (ttm, intraday): 45.45
Forward P/E (fye Dec 31, 2014)1: 26.47
PEG Ratio (5 yr expected)1: 2.51
Price/Sales (ttm): 0.99
Price/Book (mrq): 1.20
Enterprise Value/Revenue (ttm)3: 0.78
Enterprise Value/EBITDA (ttm)6: 10.30
Financial Highlights
Fiscal Year
Fiscal Year Ends: Dec 31
Most Recent Quarter (mrq): Jun 30, 2013
Profitability
Profit Margin (ttm): 2.31%
Operating Margin (ttm): 4.55%
Management Effectiveness
Return on Assets (ttm): 2.75%
Return on Equity (ttm): 2.81%
Income Statement
Revenue (ttm): 103.10M
Revenue Per Share (ttm): 4.66
Qtrly Revenue Growth (yoy): 39.10%
Gross Profit (ttm): 40.74M
EBITDA (ttm)6: 7.76M
Net Income Avl to Common (ttm): 2.38M
Diluted EPS (ttm): 0.10
Qtrly Earnings Growth (yoy): 1,717.60%
Balance Sheet
Total Cash (mrq): 23.14M
Total Cash Per Share (mrq): 1.03
Total Debt (mrq): 807.00K
Total Debt/Equity (mrq): 0.94
Current Ratio (mrq): 2.56
Book Value Per Share (mrq): 3.82
Cash Flow Statement
Operating Cash Flow (ttm): 2.88M
Levered Free Cash Flow (ttm): 799.50K
Trading Information
Stock Price History
Beta: 0.59
52-Week Change3: 16.88%
S&P500 52-Week Change3: 21.67%
52-Week High (Feb 11, 2013)3: 5.20
52-Week Low (Nov 15, 2012)3: 3.45
50-Day Moving Average3: 4.27
200-Day Moving Average3: 3.99
Share Statistics
Avg Vol (3 month)3: 81,351
Avg Vol (10 day)3: 42,363
Shares Outstanding5: 22.37M
Float: 15.71M
% Held by Insiders1: 28.07%
% Held by Institutions1: 28.00%
Shares Short (as of Sep 30, 2013)3: 343.72K
Short Ratio (as of Sep 30, 2013)3: 3.50
Short % of Float (as of Sep 30, 2013)3: 2.20%
Shares Short (prior month)3: 321.95K
Dividends & Splits
Forward Annual Dividend Rate4: N/A
Forward Annual Dividend Yield4: N/A
Trailing Annual Dividend Yield3: N/A
Trailing Annual Dividend Yield3: N/A
5 Year Average Dividend Yield4: N/A
Payout Ratio4: N/A
Dividend Date3: N/A
Ex-Dividend Date4: N/A
Last Split Factor (new per old)2: N/A
Last Split Date3: N/A
...........
Fuel-Tech, Inc. (FTEK) -NasdaqGS
4.51 Down 0.06(1.31%) 12:27PM EDT - Nasdaq Real Time Price
Date prox earnings 4 Nov
FTEK Key Statistics | Fuel Tech, Inc. Stock - Yahoo! Finance
Sono ben gradite spiegazioni e commenti, dello stock..graficamente staziona sulle medie mobili lente in daily e sma 200.. pare arrancare necessario ulteriore propellente imho..
cervellofine
Volare libero
- Registrato
- 30/10/06
- Messaggi
- 6.558
- Punti reazioni
- 194
.
6,42$
6,42$
cervellofine
Volare libero
- Registrato
- 30/10/06
- Messaggi
- 6.558
- Punti reazioni
- 194
.
7,56$
7,56$
cervellofine
Volare libero
- Registrato
- 30/10/06
- Messaggi
- 6.558
- Punti reazioni
- 194
posterò quota solo al raggiungimento della doppia cifra altrimenti amen, credo possa fare bene dopo pullback e ripartenza, lascia sotto mm lente+veloci
fzro790164
Nuovo Utente
- Registrato
- 24/9/13
- Messaggi
- 1.913
- Punti reazioni
- 62
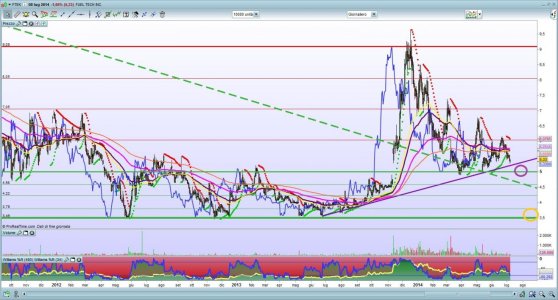
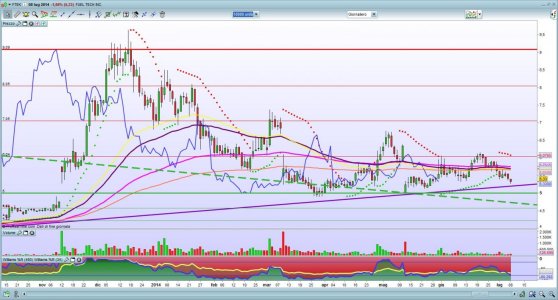
Pubblico qui AT DAILY.
Ciao Jeova...interessante titolo a livello tecnico,per il resto non conosco nulla.
L'analisi che ho fatto è provvisoria,bisogna seguirlo un pochettino ma ci sono due punti dove l'entrata ci sta come timing.
Una più azzardata è sul forte supporto 5.00
la seconda è a 3.50 molto lontano
per i miei parametri di entrata è troppo azzardata...io aspetterei la possibile reazione del supporto 5.00 e se poi dovesse violare e confermare la tenuta della EMA130 (in rosa) che a quel punto di inclinerebbe un pochettino verso alto....a quel punto io entrerei.
Comunque la osserverò nelle prossime settimane....
Allegati

Vediamo ora cosa succede:
Fuel Tech Awarded Air Pollution Control Orders Totaling $7.8 Million | MRO
Fuel Tech Awarded Air Pollution Control Orders Totaling $7.8 Million | MRO
miracolo1
Nuovo Utente
- Registrato
- 10/9/04
- Messaggi
- 4.445
- Punti reazioni
- 165
La Cina ha un problema, Fuel Tech ha la soluzione
24 ott 2014 11:13 ET | Chi: Fuel Tech, Inc. (FTEK)
Disclosure:. L'autore non ha posizioni in qualsiasi stock menzionati, e non prevede di avviare le posizioni entro le prossime 72 ore (More ...)
Sommario
• La Cina ha un problema di inquinamento. Uno così male, che la nazione emergente ha commesso centinaia di miliardi per ridurre.
• Il numero uno fonte di combustibile in Cina è il carbone.
• Fuel Tech è una società di tecnologia leader che utilizza le sue tecnologie proprietarie per combattere l'inquinamento atmosferico, soprattutto nelle caldaie a carbone - che la Cina ha circa 800.000 caldaie a carbone attualmente.
Lo scorso fine settimana, maratoneti a Pechino, in Cina erano sotto condizioni estreme . Condizioni che hanno reso estremamente difficile respirare, e non sto parlando del calore.
Questi corridori hanno dovuto affrontare quantità pericolosa di inquinamento nell'aria - qualcosa che è diventato comune tra la nazione emergente.
Ma non qualcosa il paese è disposto ad accettare per molto più tempo.
Nel 2012, la Cina disposto nel loro piano di cinque anni che avrebbero investire 56000000000 $ entro il 2015 per ridurre l'inquinamento. Nel 2013, la Cina ha annunciato che prevede di spendere $ 277.000.000.000 nel corso dei prossimi cinque anni .
Il riferimento molti piace fare è che la Cina prevede di spendere circa il PIL di Hong Kong per la lotta contro l'inquinamento atmosferico - che è un disegno di legge piuttosto pesante a piedi, ma una sola Cina intende portare a termine.
Questo è un sacco di soldi per andare in giro, abbastanza per amplificare diverse aziende. Ma ho solo uno per voi oggi - Fuel Tech (NASDAQ: FTEK ).
Compensazione Inquinamento di carbone energetico
Fuel Tech è una società di tecnologia leader che utilizza le sue tecnologie proprietarie per la lotta contro l'inquinamento atmosferico. La società opera in due segmenti principali, controllo dell'inquinamento atmosferico e dei processi del combustibile Chem.
Entrambi i processi comportano una iniezione chimica in unità di combustione. La sua tecnologia di controllo dell'inquinamento atmosferico è installato su oltre 800 unità in tutto il mondo, e basata in gran parte nelle caldaie a carbone, ma può anche migliorare olio combustibile, gas naturale, biomassa o altri combustibili.