COLUMBIA, MD -- (Marketwire) -- 04/15/11 -- New Generation Biofuels Holdings, Inc. (OTCQB: NGBF) (PINKSHEETS: NGBF) (the "Company"), a clean energy company deploying novel technologies to produce cleaner, renewable biofuels, today announced its financial results for the fourth quarter and year ended December 31, 2010.
Fourth Quarter and Full Year 2010 Financial Results
New Generation Biofuels reported revenues of $9,095 and a net loss of $4.5 million for the three months ended December 31, 2010, compared to net revenues of $101,890 and a net loss of $4.1 million for the three months ended December 31, 2009. Biofuel production decreased to 8,000 gallons in the fourth quarter of 2010 compared to 88,000 gallons the fourth quarter of 2009. Total operating expenses decreased by approximately $1.3 million for the three months ended December 31, 2010, compared to the same period in 2009. This decrease was driven by a decrease in cost of product revenue of approximately $0.7 million and a decrease in general and administrative expenses of approximately $0.6 million (resulting primarily from decreases in compensation expense of $0.2 million, terminal site lease and services expenses of $0.3 million and $0.1 million business travel expenses). Total Loss from Operations decreased by approximately $1.2 million for fourth quarter of 2010 compared to the prior year's fourth quarter.
For the full year 2010, the Company had net revenues of $15,446 and a net loss of $11.6 million, and for the full year 2009 had net revenues of $178,938 and a net loss of $14.4 million. Approximately 21,000 gallons of biofuel were produced in 2010 compared to 209,000 gallons in 2009. Total operating expenses decreased by approximately $1.8 million for the full year 2010 compared to 2009. This decrease was the result of decreases in cost of product revenue of approximately $0.7 million and in research and development expenses of approximately $0.1 million coupled with a decrease in G&A expenses of approximately $1.0 million. The overall decreases in expenses reflect the Company's efforts to properly fund its operating and development actives which resulted in limited fuel production and several management changes. Loss from Operations decreased by approximately $1.6 million for the full year 2010 compared to 2009.
As of December 31, 2010, the Company had cash on hand of approximately $0.2 million. Net cash used in operating activities was $4.6 million for the full year ended December 31, 2010, compared to $6.9 million in last year's comparable period.
"2010 was a challenging year for New Generation Biofuels. The difficulties in not closing a Strategic Joint Venture transaction, coupled with senior management departures, resulted in a decline in market value and difficulty in funding our operations and ultimately our departure from NASDAQ," said John E. Mack, Chairman of New Generation. "We have recently appointed David H. Goebel, Jr., our Chief Operating Officer, as Principal Executive Officer. Dave has many years of fuels and chemicals experience including senior management positions with ExxonMobil and is well equipped to lead our efforts as we head into the second quarter of 2011. In addition to addressing our capital needs, our operational focus will be the development and commercialization of a fuel product utilizing pyrolysis oil as the feedstock. Over the past year, our internal research and development efforts have produced several new provisional patent filings including two for this alternative use feedstock. We have had great success with pyrolysis oil solutions at the bench level and we are moving towards third party validation testing, product scale up and field testing. We believe that the successful development of a pyrolysis-based product will allow us to offer biofuel that is renewable, emission reducing and economically viable with or without government incentives. We also believe this will give us a unique position within the alternative fuel industry."
About the Company
The Company is a clean energy company deploying novel technologies to produce cleaner, renewable biofuels. The Company has rights to a portfolio of patented and patent pending technology to manufacture alternative biofuels from plant oils and animal fats that it markets as a new class of biofuel for power generation, commercial and industrial heating and marine use. The Company believes that its proprietary biofuel can provide a lower cost, renewable alternative energy source with significantly lower emissions than traditional fuels. New Generation Biofuels' business model calls for establishing direct sales from manufacturing plants that it may purchase or build and sublicensing its technology to qualified licensees. Additional information about New Generation Biofuels is available at
New Generation Biofuels - Advanced Renewable Technology.
Forward-Looking Statements
This news release contains forward-looking statements. These forward-looking statements concern the Company's operations, prospects, plans, economic performance and financial condition and are based largely on the Company's beliefs and expectations. These statements involve known and unknown risks, uncertainties and other factors that may cause actual results to be materially different from any future results expressed or implied by such forward-looking statements. The risks and uncertainties related to our business, which include all the risks attendant an emerging growth company in the volatile energy industry, including those set forth in the Company's Annual Report on Form 10-K for the year ended December 31, 2010, and in subsequent filings with the Securities and Exchange Commission. These forward-looking statements are made as of the date of this news release, and the Company assumes no obligation to update the forward-looking statements or to update the reasons why the actual results could differ from those projected in the forward-looking statements.
NEW GENERATION BIOFUELS HOLDINGS, INC.
Consolidated Balance Sheets
December 31, December 31,
2010 2009
------------ -----------
ASSETS
Current assets:
Cash and cash equivalents $ 149,909 $ 567,647
Restricted cash 14,706 -
Accounts receivable - 63,900
Other receivables 9,095 41,406
Inventories - 11,708
Debt issuance costs, net 25,000 -
Prepaid expenses and other current assets 904,254 237,635
------------ -----------
Total current assets 1,102,964 922,296
Property, plant and equipment, net 1,189,620 1,120,911
License agreement, net 5,034,545 5,650,988
Other assets, net 370,906 346,073
------------ -----------
Total assets $ 7,698,035 $ 8,040,268
============ ===========
LIABILITIES AND STOCKHOLDER'S EQUITY
Current liabilities:
Accounts payable and accrued expenses $ 1,647,449 $ 1,472,519
Loan payable - 50,000
Convertible notes payable
(net of unamortized debt discount of $11,141
and $-) 518,859 -
License agreement payable, current portion
(net of unamortized debt discount of $291,844
and $375,467) 708,156 624,533
Accrued dividends on preferred stock 1,083,666 1,078,003
Derivative liabilities 12,692 110,874
------------ -----------
Total current liabilities 3,970,822 3,335,929
License agreement payable
(net of unamortized debt discount of $331,995
and $622,274) 2,668,005 3,377,726
Deferred rent 149,069 324,409
------------ -----------
Total liabilities 6,787,896 7,038,064
Commitments and contingencies - -
Stockholders' equity:
Preferred stock; $0.001 par value; 9,450,000
shares authorized; no shares issued and
outstanding at December 31, 2010 and 2009 - -
Series A Cumulative Convertible Preferred
Stock; $0.001 par value; $100.00 stated
value; 300,000 shares authorized, 0 and
18,400 shares issued and outstanding as of
December 31, 2010 and 2009, respectively;
aggregate liquidation preference of $- - 710,970
Series B Cumulative Convertible Preferred
Stock; $0.001 par value; $100.00 stated
value; 250,000 shares authorized, 45,785
shares issued and outstanding as of December
31, 2010 and 2009, respectively; aggregate
liquidation preference of $5,662,200 3,094,872 3,094,872
Common stock; $0.001 par value; 100,000,000
shares authorized; 82,083,896 and 31,711,578
shares issued and outstanding as of December
31, 2010 and 2009, respectively 82,083 31,712
Additional paid-in-capital 60,380,709 47,593,489
Accumulated deficit (62,647,525) (50,428,839)
------------ -----------
Total stockholders' equity 910,139 1,002,204
------------ -----------
Total liabilities and stockholders' equity $ 7,698,035 $ 8,040,268
============ ===========
NEW GENERATION BIOFUEL HOLDINGS, INC.
Consolidated Statements of Operations
For the Year For the Year
Ended Ended
December December
31, 2010 31, 2009
------------- -------------
Revenues:
Product $ 6,351 $ 137,532
Alternative fuel tax credit 9,095 41,406
------------- -------------
Total revenue 15,446 178,938
------------- -------------
Operating expenses:
Cost of product revenue (including
depreciation and amortization of $722,432
and $685,806, respectively) 1,604,961 2,311,576
Research and development 340,559 475,013
General and administrative 8,791,536 9,751,064
------------- -------------
Total operating expenses 10,737,056 12,537,653
------------- -------------
Loss from operations (10,721,610) (12,358,715)
Other income and (expenses):
Interest income 676 3,458
Interest expense (790,342) (537,661)
Gain on extinguishment of trade payables, net 1,330,895 -
Gain on extinguishment of loan payable 50,000 -
Loss on extinguishment of convertible debt (33,949) -
Induced conversion loss (1,198,090) -
Loss on conversion of debt (475,347) -
Gain on extinguishment of license agreement
payable 154,000 241,500
Gain (loss) on net change in fair value of
derivative liabilities 82,800 (1,745,383)
------------- -------------
Total other income (expenses), net (879,357) (2,038,086)
------------- -------------
Net loss (11,600,967) (14,396,801)
Deemed dividend as a result of warrant
modification (123,722) -
Dividends to preferred stockholders (493,997) (4,691,379)
------------- -------------
Net loss attributable to common stockholders $ (12,218,686) $ (19,088,180)
============= =============
Basic and diluted net loss per share $ (0.26) $ (0.73)
============= =============
Weighted average number of shares outstanding 46,454,471 26,236,636
============= =============
NEW GENERATION BIOFUELS HOLDINGS, INC.
Consolidated Statements of Cash Flows
For the Year For the Year
Ended Ended
December 31, December 31,
2010 2009
CASH FLOWS FROM OPERATING ACTIVITIES:
Net loss $ (11,600,967) $ (14,396,801)
Adjustments to reconcile net loss to net cash
used in operating activities:
Bad debt expense 5,609 7,208
Inventory write-downs 11,708 -
Amortization of prepaid consulting fee 1,041,589 662,323
Amortization of debt issuance costs 120,665 -
Depreciation and amortization expense 85,012 68,251
Loss on disposal of property and equipment - 70,974
Amortization of license agreement 616,443 616,472
Amortization of patents 33,215 23,700
Amortization of debt discount on license
agreement payable 373,902 537,661
Amortization of debt premium on convertible
notes (4,367) -
Amortization of debt discount on
convertible notes 170,228 -
Compensation expense associated with stock
options and restricted stock to employees 2,324,668 3,293,318
Stock options issued to non-employees for
services 17,603 35,684
Non-cash severance expense 270,000 -
Warrants issued in connection with debt
modifications 77,117 -
Gain (loss) on change in fair value of
derivative liabilities (82,800) 1,745,383
Gain on extinguishment of trade payables,
net (1,330,895) -
Gain on extinguishment of loan payable (50,000) -
Loss on extinguishment of convertible debt 33,949 -
Loss on conversion of debt 475,347 -
Induced conversion loss 1,198,090 -
Gain on extinguishment of license agreement
payable (154,000) (241,500)
Changes in operating assets and
liabilities:
Accounts receivable 58,291 (40,957)
Other receivables 32,311 (41,406)
Inventories - (11,708)
Prepaid expenses and other current assets 77,792 29,073
Other assets (534) 176,971
Accounts payable and accrued expenses 1,697,176 211,941
Deferred rent (112,182) 324,409
Net cash used in operating activities (4,615,030) (6,929,004)
CASH FLOWS FROM INVESTING ACTIVITIES:
Net increase in restricted cash (14,706) -
Purchases of property and equipment (153,721) (881,190)
Capitalized patent costs (57,514) (161,744)
Net cash used in investing activities (225,941) (1,042,934)
CASH FLOWS FROM FINANCING ACTIVITIES:
Payments for license agreement payable (120,000) -
Proceeds from the issuance of convertible
notes 1,075,000 -
Debt issuance costs (70,000)
Proceeds from issuance of common stock, net 3,451,768 7,063,339
Proceeds from exercise of warrants 86,465 -
Net cash provided by financing activities 4,423,233 7,063,339
Decrease in cash and cash equivalents (417,738) (908,599)
Cash and cash equivalents - beginning of year 567,647 1,476,246
Cash and cash equivalents - end of year $ 149,909 $ 567,647
Supplemental Disclosure of Non-Cash Operating
and Financing Activities
Accrued dividends on preferred stock $ 493,997 $ 686,218
Issuance of restricted stock to non-employees
for prepaid consulting services $ 1,786,000 $ 137,900
Issuance of warrants to non-employees for
prepaid consulting services $ - $ 595,793
Issuance of common stock for payment of
accounts payable and accrued expenses $ 208,676 $ 25,000
Common stock issued for payment of license
agreement payable $ 726,000 $ 758,500
Anti-dilution obligation associated with
issuance of common stock $ 40,000 $ 102,500
Common stock warrant liability $ - $ 2,214,371
Reclassification of warrant liability in
connection with waiver of anti-dilution
provision $ - $ 4,053,043
Reclassification of warrant liability in
connection with anti-dilution triggering
event $ - $ 158,451
Cumulative effect of reclassification of
warrants (ASC Topic 815) $ - $ 260,115
Issuance of common stock settlement of
anti-dilution obligation $ 58,449 $ -
Issuance of warrants with convertible debt $ 149,949 $ -
Issuance of warrants for debt issuance costs $ 38,165 $ -
Issuance of common stock for debt issuance
cost $ 37,500 $ -
Deemed dividend related to beneficial
conversion feature on Series B Preferred
Stock $ - $ 4,005,161
Conversion of Series A preferred stock to
common stock $ 710,970 $ 309,117
Conversion of Series B preferred stock to
common stock $ - $ 1,928,557
Accrued preferred stock dividends converted
into shares of common stock $ 488,334 $ 373,585
Debt discount as a result of beneficial
conversion feature associated with
convertible debt modification $ 69,474 $ -
Issuance of warrants in connection with debt
modification $ 77,117 $ -
Warrants issued for payment of accounts
payable and accrued expenses $ - $ 99,732
Deemed dividend to as result of warrant
modification $ 123,722 $ -
Common stock issued in connection with the
settlement of convertible debt $ 500,000 $ -
Common stock issued in connection with the
settlement of accrued interest $ 30,833 $ -
Conversion of debt to common stock $ 4,653 $ -
Issuance of common stock for separation
agreements $ 270,000 $ -
Embedded conversion feature on convertible
debt $ 46,875 $ -
Common stock warrants reclassified to equity
from common stock warrant liability on June
3, 2010 $ 43,808 $ -
 qualche news da questo ciofechino di titolo?
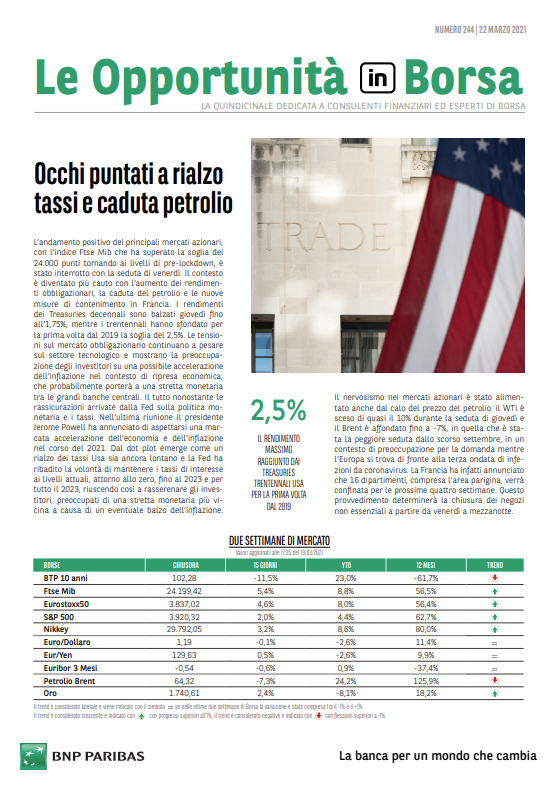 La settimana è stata all’insegna degli acquisti per i principali listini internazionali. Gli indici americani S&P 500, Nasdaq e Dow Jones hanno aggiornato i massimi storici dopo i dati americani sui prezzi al consumo di mercoledì, che hanno evidenziato una discesa in linea con le aspettative, con l’inflazione headline al 3,4% e l’indice al 3,6% annuo, allentando i timori per un’inflazione persistente. Anche le vendite al dettaglio Usa sono rimaste invariate su base mensile, suggerendo un raffreddamento dei consumi che hanno fin qui sostenuto i prezzi. Questi dati, dunque, rafforzano complessivamente le possibilità di un taglio dei tassi a settembre da parte della Fed (le scommesse del mercato sono ora per due tagli nel 2024). Per continuare a leggere visita il link

