A proposito della low volatility, vi segnalo un intervento un po' critico:
Swedroe: Be Wary Of The Low Vol Factor
Qualche estratto interessante:
Riassumendo e traducendo, le strategie low-volatility scambiano il rischio azionario (volatilità) con il rischio "value" (proprio delle azioni sottovalutate) e con il rischio tassi (proprio delle obbligazioni). Con l'arrivo della popolarità le azioni low-vol sono diventate care: il rischio "value" (con il relativo premio) non c'è più. E, stante il possibile rialzo dei tassi d'interesse, il rischio tassi potrebbe ritorcersi contro la strategia.
Uomo avvisato ...

Le società delle azioni a bassa volatilità sono soprattutto quelle che tendono ad avere cash flow e utili più stabili e prevedibili della media.
Ci sono parziali sovrapposizioni con le strategie Brands e Franchise di fondi a gestione attiva che investono sovrappesando società leader del settore Consumer Staples.
Anche per il settore Consumer Staples è stata osservata su lunghi periodi performance superiore a quella del mercato e con volatilità più bassa.
Non necessariamente le azioni a bassa volatilità sono state sottovalutate in passato.
Dipende dalle fasi di mercato.
(Da periodi di osservazione non abbastanza lunghi si possono trarre generalizzazioni in parte fuorvianti.)
E in passato anche se hanno sovraperformato nel lungo termine, per anni e per alcuni periodi prolungati hanno sottoperformato.
Nelle fasi di crescita economica e quando gli investitori si accorgono che paga investire su aziende dagli utili instabili che in alcune fasi sorprendono in positivo, le azioni a bassa volatilità sottoperformano.
In alcune fase gli investitori preferiscono pagare un premio per azioni a bassa volatilità, in altre fasi preferiscono pagare un premio per azioni Growth più volatili.
Se si vuole investire in azioni sottovalutate in base ad alcuni parametri, ci sono fondi value e qualche ETF value.
Per gli indici ed ETF low e minimum volatility bisogna vedere ogni quanto tempo viene rivista la composizione, se si teme che certe azioni possano diventare volatili in futuro.
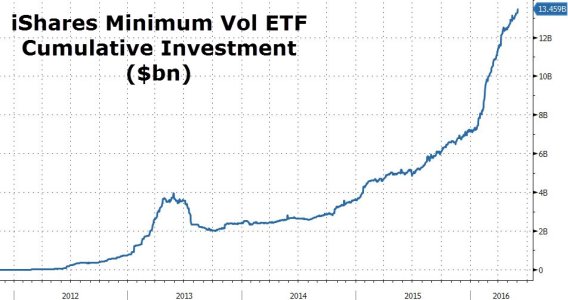
Dalla seconda metà dell' anno scorso c' è una ripresa di interesse per le azioni low volatility. Anche perché ci sono stati periodi di avversione al rischio e dubbi sulla possibilità del bull market azionario USA di proseguire.
Già nel 2011 c' era interesse per gli ETF low volatility negli USA e sul mercato venivano lanciati prodotti del genere.
Beat the Market—With Less Risk - WSJ
By BEN LEVISOHN
October 1, 2011
With the gut-churning volatility of the past few years showing no sign of letting up, some investors are swearing off stocks and piling into safe havens like cash and Treasurys.
But what if there were a way to beat the stock market's returns over the long haul with significantly less short-term instability?
In this age of Ponzi-scheme blowups and complex financial instruments that self-destruct in times of crisis, such a notion sounds too good to be true. Yet academic research has shown that a relatively simple strategy of buying the least-volatile stocks and holding them for the long term has matched the overall market's returns—without the violent swings.
From the beginning of August through Thursday, the Standard & Poor's Low Volatility Index, a portfolio of the 100 least-volatile stocks in the S&P 500-stock index, lost just 1.1%, compared with a 9.8% drop for the S&P 500 overall. That, of course, is to be expected, since the least-risky stocks tend to outperform during nasty short-term selloffs.
More surprising, however, is that the Low-Volatility Index has returned 80% during the past 10 years, compared with the S&P 500's 42.9%, assuming reinvested dividends. Go back 20 years, a period that includes most of the go-go 1990s, and the index has beaten the S&P 500 by about 180 percentage points, according to S&P, which set up the Low Volatility Index in April.
Academic research suggests the low-volatility strategy has worked for even longer periods. The least-volatile quintile of the 1,000 biggest stocks in the U.S. returned 10.2% annually from 1968 to 2010, while the most-volatile quintile gained 6.6%, according to Brendan Bradley of Acadian Asset Management in Boston, who earlier this year published a study on the returns of low-volatility stocks with Malcolm Baker of Harvard University and Jeffrey Wurgler of New York University in the Financial Analysts Journal. The U.S. stock market overall returned 9.6% during the same period.
Money managers are starting to catch on. Until this year only a few firms—Dutch money manager Robeco, Los Angeles-based Analytic Investors and Acadian among them—offered portfolios that use low-volatility strategies, and they made them available primarily to institutions. Now firms are rolling out mutual funds and exchange-traded funds to capture what they see as a burgeoning demand for such products.
"There's a huge amount of interest out there," says James Sefton, senior quantitative analyst at UBS in London. "You take less risk and get more return."
Why Does It Work?
The success of low-volatility investing flies in the face of what most investors consider the central axiom of investing: the greater the risk, the greater the reward. Yet over the past 20 years, seemingly stodgy sectors such as consumer staples and health care have beaten faster-growing ones such as industrials, according to FactSet Research Systems data.
There are various theories as to why low-volatility stocks have outperformed. Some observers say it simply is a matter of compounding: If an investor has $10,000 invested in a stock that falls 10%, he will have to make 11% to get back to $10,000; if the same investor loses 20% in a stock, the shares will have to jump 25% to get back to flat. Repeat the cycle multiple times, and those extra percentage points start to add up.
"If you reduce the volatility, you have fewer losses to make up," says Mark Rylance, president of investment adviser RS Crumb in Newport Beach, Calif.
Others attribute the phenomenon to bad habits. Investors, they argue, gravitate toward stocks in the news, which tend to be flashier, more-volatile companies like Apple and Netflix. They also look for "lottery tickets"—stocks that could double or triple their money, says Eric Falkenstein, an economist and financial consultant in Eden Prairie, Minn. Fund managers, meanwhile, favor volatile stocks because they believe they can pick winning stocks and that riskier ones will help them beat their benchmark.
Because everyone's chasing the glamour stocks, those shares tend to be overpriced over the long run, especially relative to less-volatile stocks. "The dumb money jumps on the hot stocks trying to triple their money," Mr. Falkenstein says. "Low volatility eliminates the froth."
Caveats
The low-volatility strategy has some downsides. The biggest: It can underperform badly when the overall market is rising. That is because investors tend to pile into riskier stocks during big rallies. For example, the S&P Low-Volatility Index approach gained only 19.2% in 2009, compared with 26.5% for the S&P 500.
Low-volatility stocks also tend to generate higher dividend yields, because
such companies often have predictable cash flows and stable earnings. The PowerShares S&P Low-Volatility Portfolio exchange-traded fund has a dividend yield of 3.4%, compared with 2.1% for the SPDR S&P 500 ETF.
From the beginning of August through Thursday, the Standard & Poor's Low Volatility Index, a portfolio of the 100 least-volatile stocks in the S&P 500-stock index, lost just 1.1%, compared with a 9.8% drop for the S&P 500 overall. That, of course, is to be expected, since the least-risky stocks tend to outperform during nasty short-term selloffs.
Sometimes the market can rally for long stretches, making the pain of missing out even worse. Low-volatility stocks gained 126% for the eight years leading up to the dot-com peak in March 2000, for example—less than half of the S&P 500's 307% rise.
The upshot: Investors who embrace this strategy should be focused on the long term.
"You need to have an honest conversation with yourself," says Joe Wolfe, director of quantitative research at Northern Trust in Chicago. "You have to be able to live with the results."
Yet even if market sentiment turns to riskier assets, investors aren't likely to lose money, says Pim van Vliet, a senior portfolio manager at Robeco—they will underperform only until the next bout of risk aversion. "If your neighbor earns a lot of money, you may feel poor," Mr. van Vliet says. "But if you look at what you can do with your money, you'll feel rich."
Here's how to implement the low-volatility strategy—or elements of it—in your portfolio.
New Funds
Until recently, there weren't many mutual funds or ETFs dedicated to low-volatility investing. Wells Fargo Investment Advisors took a stab at it back in the 1970s, when it launched StageCoach, a mutual fund designed with help from financial legends Fischer Black and Myron Scholes. The concept never caught on, in part because the market started taking off in 1982 and investors began courting more risk.
"People didn't want these strategies when we were in one of the longest bull markets in history," says Mr. Sefton of UBS.
LOW VOLATILITY AND LOW BETA ETFS
Today's volatile markets have brought the concept back to life. Five exchange-traded funds dedicated to buying low-volatility stocks have been launched during the past five months, some of which track "beta," one measure of volatility: PowerShares S&P 500 Low Volatility Portfolio, Russell 1000 Low Beta, Russell 1000 Low Volatility, Russell 2000 Low Beta and Russell 2000 Low Volatility. On Sept. 13, QuantShares launched the U.S. Market Neutral Anti-Beta Fund, which bets against the highest-beta stocks and buys the ones with the lowest betas.
More funds are on the way. PowerShares has filed plans with regulators to launch developed-market and emerging-market low-volatility ETFs using S&P indexes, while iShares has filed for its own versions of the strategy, which will use MSCI's Minimum Volatility indexes.
Key Differences
All of the funds have held up better than their benchmarks over the past three months, but their performance has varied greatly. The Powershares ETF has declined just 3.6% during the past three months, much better than the S&P 500's 10.8% drop. By contrast, Russell 1000 Low Beta is down 6.7%, while Russell 1000 Low Volatility is down an even steeper 8.4%, compared with the Russell 1000's 11.5% fall.
The Russell 2000 Low Beta and Low Volatility ETFs, meanwhile, have dropped 11.7% and 10.2%, respectively, during the past three months, compared with the Russell 2000's 20.1% decline.
While all of these funds promise low volatility, they go about producing it in slightly different ways. Some of them use "standard deviation," a measure of how much a stock's price departs from the average over a period of time. Others use beta, which measures the volatility of a stock relative to the overall market. The most complex portfolios use "minimum variance" algorithms, a strategy that incorporates beta, standard deviation and other measures to build a low-volatility portfolio.
Investors will inevitably hear arguments in favor of one or the other, but they shouldn't spend too much time worrying about the differences, advisers say. "The way to capture low volatility is not an important distinction," Mr. Falkenstein says. "These approaches generally capture the same thing."
The main difference among funds, says Samuel Lee, an analyst at investment-research firm Morningstar, is the time frames the managers use to measure volatility and their rebalancing schedules.
The PowerShares ETF buys the 100 least-volatile stocks in the index based on standard deviation over the past 12-months. The stocks with the lowest volatility get the highest weights, and the portfolio is "rebalanced" quarterly, meaning it boots out the stocks whose volatilities have increased in favor of those that have decreased.
The ETF's 10 largest holdings include utilities Southern Co., Consolidated Edison and Duke Energy, consumer-staples companies including Procter & Gamble and Kimberly-Clark, and Wal-Mart Stores. All told, it has 12.9% of the portfolio in its 10 largest holdings, according to Morningstar. The fund's expense ratio is 0.25%.
The Russell 1000 Low Volatility ETF, by contrast, ranks the stocks in the Russell 1000 by 60-day standard deviation, and adds stocks until the portfolio has 35% of the market cap of the Russell 1000. It rebalances monthly, meaning the portfolio tends to have more turnover, which may increase trading expenses.
The fund's 10 largest holdings include Southern Co. and Kimberly-Clark, but also IBM and Verizon Communications, according to Morningstar. Combined, they make up 20.9% of the portfolio. Its expense ratio is 0.49%.
"The decision to rebalance on a monthly basis was made based on the need to maintain an ongoing active exposure to a target factor such as volatility," a Russell spokesman says. The fund "can be rebalanced on a monthly basis while simultaneously targeting low turnover."
Morningstar's Mr. Lee favors the PowerShares fund because of its low fees, limited turnover and simple construction. "It's the first good low-volatility ETF," he says.
The markets seem to be reaching a similar conclusion. The PowerShares ETF has collected about $300 million since its launch. The four Russell ETFs have amassed less than $50 million combined.
Picking Stocks
Ambitious investors also have the option of devising low-volatility portfolios for themselves. It takes some legwork, however.
First, Mr. Falkenstein says, you need to choose an index, such as the S&P 500 or Russell 3000. Next, you buy equal dollar amounts of the companies with the lowest standard deviation or beta, making sure to exclude real-estate investment trusts, ETFs and stocks that trade infrequently.
The advantage of this approach is that you can tweak the portfolio to your liking. For instance, Mr. Sefton says that because some low-volatility stocks are looking pricey these days, you could reduce the weightings of those companies in favor of cheaper "deep value" stocks. Another option is to favor low-volatility stocks that pay a high dividend, a strategy favored by Mr. Sefton and Northern Trust's Mr. Wolfe.
There are downsides to the do-it-yourself approach, however. You have to buy a lot of different stocks—at least 50, though preferably 100, advisers say—to make sure the portfolio is properly diversified. And you would need to rebalance the portfolio at least twice a year, but not so often that it boosts transaction costs.
At the moment, some of the 100 stocks in the S&P 500 with the lowest beta and standard deviation include Family Dollar Stores (a beta of 0.1), General Mills (0.2), and Hershey (0.2), as well as Gilead Sciences (0.4), Watson Pharmaceuticals (0.4) and soda-can producer Ball (0.5).
Too Trendy?
One fear now is that the strategy will lose some of its effectiveness as it gains popularity. That has been the case over the years with a number of market anomalies that, once recognized, have subsequently weakened. The "size effect," for example, noted that small stocks earned higher returns than expected, while the "January effect" pointed out that stocks almost always increase during the first month of the year. Both have been much less reliable since they were first popularized.
Mr. van Vliet doesn't see the low-volatility strategy suffering a similar fate anytime soon. Too many investors, he says, still believe they can find value by trying to time the market.
"It's not that everyone is irrational," he says. "We just have a different objective."
Beat the Market—With Less Risk - WSJ