La verità(???), mi spiego(?!?), sui mercati(...)

Gianni78bari

Nuovo Utente
Registrato
16/2/17
Messaggi
151
Punti reazioni
32
Un paio di anni fa e oltre, avevo cominciato a scrivere qui sul forum di opzioni, Black and Scholes et similia.
Riparto da qui, da zero, nel senso che ampio il discorso cominciando dalla base e mettendo mattone su mattone quello che è ad oggi un work in progress e sempre lo sarà, come in ogni cosa della vita.

Negli anni ho maturato l'idea che il mercato è come una bella donna, e qui ognuno può pensare al suo modello di bellezza; da un casuale incrocio di sguardi per strada, scatta l'episodio pilota, che il più delle volte è una "sega mentale" perchè lei magari neanche ti ha inquadrato e sta pensando ai suoi problemi di stitichezza.
Se poi l'incrocio è ripetuto nel tempo sul tram o nella metropolitana il pilota diventa una serie tv da 20 stagioni, tanto più lunga quanto più sfigato sei.
Siamo ancora alla prima fase quando si comincia ad osservare come si muovono indici, azioni, obbligazioni, cfd, gratta e vinci ecc. ecc. che sembrano essere lì pronti a "darla", in particolare a noi.
E se capita che attacchi bottone, lei si fa offrire un caffè e vi scambiate il numero, a quel punto quanti più problemi, inesperienza, insoddisfazione, insicurezze hai, tanto più ci perdi la testa, illudendoti di fare la cosa giusta, rimettendoci tutto senza avere nulla in cambio.

Su questa dinamica si basano ad esempio le truffe online, quelle in cui un profilo fake femminile su un qualunque social ne contatta uno maschile e manipola il soggetto fino a farsi bonificare decine di migliaia di euro, senza nemmeno che i due si incontrino mai (per lavoro sono venuto a conoscenza diretta di più di un caso di adescamento virtuale e "dal vivo").

Se ci si ferma un attimo a pensarci, succede lo stesso coi mercati, ed il fatto che la dinamica di cui sopra sia appannaggio prettamente dell'universo maschile, potrebbe essere una possibile spiegazione del perchè sui vari gruppi telegram, forum eccetera sul tema trading, le donne siano una rarità.

Fatta questa premessa, la naturale conseguenza è che se si vuole investire bisogna essere attrezzati di consapevolezza, esperienza, competenza e capitali perchè nessuno dà niente in cambio di niente.


Parto quindi proprio da cosa significa diventare "esperti" nel mondo dell'investimento, se questo è davvero possibile farlo e in che modo.
E' un post aperto nel senso che non dà una risposta definitiva ma degli elementi che vogliono essere il più oggettivi possibile; è l'approccio che seguirò andando avanti, cioè concetti rielaborabili individualmente per poter maturare quella consapevolezza di cui c'è bisogno. Questo è un punto importante perchè spesso chi fa analisi di mercato le fa in modo da vendere la sua visione del mondo a prescindere dalla suo oggettività. Può farlo inconsapevolmente o in mala fede, ma il risultato è sempre lo stesso per chi le legge.

Utilizzo substack per raccogliere i post che è la piattaforma migliore sotto tutti i punti di vista.
Sono in inglese, ma l'inglese scritto da un italiano è comprensibile per tutti.

Is it really possible to become an expert trader/investor?
 
Riprendo l'argomento iniziale riguardo cosa significhi diventare un esperto in un determinato campo.
Questo articolo di Ippoliti sottolinea le pecurialità del campo della finanza ed è un ideale completamento di quanto scritto sopra:
Come spiegare ai clienti perché la diversificazione a volte sottoperforma
Nell’investimento l’informazione è sempre incompleta. È un po’ come il poker e è molto diverso dagli scacchi dove l’informazione è tutta sulla scacchiera.

Negli scacchi vince sempre il più forte. Nel poker si può vincere anche per fortuna ma un giocatore che adotta un metodo collaudato alla fine ha più probabilità di successo.
Nelle situazioni di informazione incompleta, un risultato positivo potrebbe essere frutto di fortuna, mentre un risultato negativo potrebbe essere la conseguenza sfortunata di un processo decisionale giusto.

Bisogna quindi sfuggire alla tendenza di giudicare il processo decisionale dal risultato. Questo è invece quello che facciamo di solito. Si dice che “la storia è scritta dai vincitori”.

Negli investimenti ciò che conta è adottare un metodo che ci dia più possibilità di vincere nel lungo periodo.
 
Qui un esempio applicato al Cape:
Let’s talk about the CAPE ratio. It’s one of the most widely-followed stock market valuation and investing metrics. It’s being talked about more as investors wonder whether stocks are poised to lose ground in 2022. Unfortunately, the signal of doom it supposedly sends is a myth.

CAPE, or cyclically adjusted price-earnings, was popularized by Nobel prize-winning economist Robert Shiller. It’s calculated by taking the price of the S&P 500 and dividing it by the average of 10 years’ worth of earnings. When CAPE is above its long-term average, the stock market is thought to be expensive.

Many market watchers use above-average CAPE readings as a signal that stocks should underperform or even fall as it reverts back to its long-term mean.

But CAPE’s mean doesn’t actually have much pull.

“While valuations feature importantly in our toolbox to estimate forward equity returns, we should dispel an oft-repeated myth that equity valuations are mean-reverting,” Goldman Sachs analysts wrote in a new note to clients.


The analysts began their discussion by noting that the problematic assumption that a mean exists for metrics like CAPE to revert to.

“Mean reversion assumes that market valuation metrics … are stationary and their long-term means do not change,” they wrote.

In recent decades, valuation metrics have been persistently high, which have actually forced these long-term means to move higher. Not long ago, GMO’s Jeremy Grantham made this observation to argue that valuations were in a “new normal” at elevated levels.

‘We have not found any statistical evidence of mean reversion’
At any rate, the case for mean-reversion is weak.

“We have not found any statistical evidence of mean reversion,” the Goldman Sachs analysts wrote. “Equity valuations are a bounded time series: there is some upper bound since valuations cannot reach infinity, and there is a lower bound since valuations cannot go below zero. However, having upper and lower bounds does not imply valuations are stationary and revert to the same long-term mean.”

The Goldman analysts did the math, and the key metric to look at in the chart below is the statistical significance.

“The statistical significance over the full sample is 26%. This means that there is only 26% confidence that the Shiller CAPE is mean-reverting, and 74% confidence that it is not. The traditional threshold to consider a relationship statistically significant is 95%.”
1710703984234.png

In other words, you can’t rely on CAPE to gravitate toward any mean.

The Goldman analysts, however, weren’t done busting the myth and took issue with the concept of the CAPE ratio in general.

“Even if we ignored this threshold, the time between valuations crossing into their 10th decile and reverting to their long-term average is beyond a reasonable investment horizon for a tactical decision,” they said. “For example, the Shiller CAPE entered its 10th decile in August 1989 but did not revert to its long-term mean for 13 years.“

In other words, trading based on the assumption CAPE will mean-revert could lead to indeterminate years of getting smoked by the market.
The big picture
“We want to emphasize that valuations alone are not sufficient measures for underweighting equities,” the Goldman analysts wrote. “High valuations do not reach some magical target and then revert to some stable mean; furthermore, the time period for valuations to reach some long-term average is highly variable and therefore uncertain.”

Valuation metrics like CAPE and forward P/E aren’t totally worthless. By definition, they offer a simple way of estimating the premium an investor pays for a company’s earnings.

However, they simply don’t do a great job of telling you what stock prices will do in the coming days, months, or even years.
 
Perchè gli indici salgono?

Questa è la prima parte della spiegazione del bias rialzista degli indici azionari
Aggiungerei ai 3 fattori indicati un quarto, non meno importante. E' il continuo trasferimento della ricchezza dagli enti centrali, come stati nazionali, enti governativi, enti locali agli individuals e aziende private.

Per quanto riguarda l'italia, si stima che siano stati trasferiti con il Covid non meno di 180 miliardi dello stato finiti sui conti correnti dei cittadini, che traboccano di liquidita'. Per gli Usa ho sentito numeri da far paura, nell'ordine di migliaia di miliardi. Ora il debito mondiale degli enti pubblici che dispensano denaro con la cornucopia e' divenuto di 56.000 miliardi.

Se solo una minima parte delle elargizioni pubbliche viene investita nelle borse, ecco il quarto motivo per cui gli indici salgono.

Questo quarto fattore dovra' prima o poi avere fine con un consolidamento dei debiti pubblici statali e conseguente ristrutturazione e detto fenomeno creera le condizioni ideali per quel crac generale di tutte le asset class, peraltro atteso da molti ribassisti come il key note abituale presente nelle trasmissioni in podcast di Phastidio.

Il dubbio unico, che un po' ci riguarda tutti, e' se si trattera' di ristrutturazione con haircut oppure ristrutturazione con compensazione della ricchezza privata.
 
Ultima modifica:
Aggiungerei ai 3 fattori indicati un quarto, non meno importante. E' il continuo trasferimento della ricchezza dagli enti centrali, come stati nazionali, enti governativi, enti locali agli individuals e aziende private.

Per quanto riguarda l'italia, si stima che siano stati trasferiti con il Covid non meno di 180 miliardi dello stato finiti sui conti correnti dei cittadini, che traboccano di liquidita'. Per gli Usa ho sentito numeri da far paura, nell'ordine di migliaia di miliardi. Ora il debito mondiale degli enti pubblici che dispensano denaro con la cornucopia e' divenuto di 56.000 miliardi.

Se solo una minima parte delle elargizioni pubbliche viene investita nelle borse, ecco il quarto motivo per cui gli indici salgono.

Questo quarto fattore dovra' prima o poi avere fine con un consolidamento dei debiti pubblici statali e conseguente ristrutturazione e detto fenomeno creera le condizioni ideali per quel crac generale di tutte le asset class, peraltro atteso da molti ribassisti come il key note abituale presente nelle trasmissioni in podcast di Phastidio.

Il dubbio unico, che un po' ci riguarda tutti, e' se si trattera' di ristrutturazione con haircut oppure ristrutturazione con compensazione della ricchezza privata.
Grazie per lo spunto molto interessante

Ho scritto qualcosa in proposito qui:
Where are interest rates headed?
Questa è la parte attinente al meccanismo di cui parli

Western countries and China themselves face a dilemma: the ability to sustain growth through support and investments in key sectors while maintaining an adequate level of welfare and at the same time keeping the debt-to-GDP ratio below alert levels.

As long as money was cheap and easy, governments could spend without worrying about debt, but high interest rates make it harder for businesses to make profits and for governments to act.
[...] in a situation of high private and public debt and state deficits, high interest rates for an extended period can trigger a so-called Minsky moment.
[What's a Minsky moment?
Over periods of prolonged prosperity, the economy transitions from financial relations that make for a stable financial system to financial relations that make for an unstable system. In particular, over a protracted period of good times (the virtuous effect of growth rates higher than the average cost of debt), capitalist economies tend to move from a financial structure dominated by hedge finance units to a structure in which there is a large weight to units engaged in speculative and Ponzi finance.
Hedge financing units are those that can fulfill all of their contractual payment obligations by their cash flows;
Speculative finance units are units that can meet their payment commitments on “income account” on their liabilities, even as they cannot repay the principal out of income cash flows. Such units need to “roll over” their liabilities: (e.g. issue new debt to meet commitments on maturing debt). For Ponzi finance units, the cash flows from operations are not sufficient to fulfill either the repayment of the principal or the interest due on outstanding debts by their cash flows from operations. Such units can sell assets or borrow. Borrowing to pay interest or selling assets to pay interest (and even dividends) on common stock lowers the equity of a unit, even as it increases liabilities and the prior commitment of future incomes. A unit that Ponzi finances lowers the margin of safety that it offers the holders of its debts.
Minsky moment is when the Ponzi scheme collapsed].

There is a need to overcome this historic transition which will likely see an increase in productivity and a reduction in costs, thanks to the new energy paradigm and AI; on the other hand, there will be a rethinking of welfare, education, and healthcare.

To do this, money is needed, and it can only come from the finances of the involved governments.
There is therefore a need to keep the debt-to-GDP ratio under control.
Given the necessity of running deficits, it is even impossible to generate primary surpluses.

So, what is the possible solution?

Di possibili soluzioni parla Joachim Klement.

Lascio qui I link ai suoi articoli al riguardo.
A me Klement piace molto: è un fisico; è uno che i soldi li gestisce davvero; deve dar conto dei risultati; condivide ogni giorno le ricerche che fa per lavoro scandagliando paper scientifici di varia natura, cercando di basarsi il più possible sui fatti.


Di seguito 4 articoli in tema, magari in futuro si potrà tornare qui e vedere se avranno avuto una loro validità.

Faccio copia incolla qui di seguito
 
The government debt ‘bomb
The government has too much debt, our deficits are too large, and this is all going to end in ruin through a massive debt default. That has been the rallying cry of fiscal conservatives for decades. I have a lot of sympathy for this rallying cry. After all, I am German, and we Germans are notoriously debt averse. Having more government debt means the cost of servicing this debt increases and that means that there is less money available for government investments, social services, etc. All this means there is less GDP growth. But it does not mean that the government will go bankrupt and default on its debt.

In fact, some time ago, a guy wrote about England and its unsustainable government debt. One of the main results of excessive debt in his opinion was the rise of inflation as paper money flooded the economy driving prices and wages up in the process. Furthermore, he was particularly worried about the fact that so much debt was held by foreigners who could use that debt as blackmail against the country. His conclusion was that the government would have to either raise taxes to pay for all that debt or default if it became too large.

That guy was the philosopher David Hume and he wrote that in 1764. It has been 260 years since he made that forecast and the debt of the UK government has grown exponentially since then, well beyond anything he or anyone else at the time could have imagined. Yet, today, the UK still is one of the very few countries in the world that has never defaulted on its debt, never had hyperinflation, and Sterling, while not exactly the world’s strongest currency is still one of the five most important and most traded currencies in the world.

This is a story that isn’t well known today, yet it clearly shows what I have talked about in the first installment of this series: What cannot happen, will not happen. If the consequences of an action are too extreme and too painful, people will find ways to turn away from the precipice and change course. The UK has done that for 260 years by changing policies that sometimes were more austere and aimed at reducing debt while being more spendthrift at other times. As a result, Hume’s forecast has been wrong for nine generations. How long do we have to wait before we admit that there might be something wrong with the ‘debt bomb’ argument?

But let us get back to the present day and examine the example of the US (though we can do the same calculation for the UK or Eurozone). The chart below shows the growth in US public debt relative to GDP together with the growth in the Fed balance sheet relative to GDP. Clearly, debt has increased tremendously over the years. And thanks to the Fed’s QE programmes, the Fed balance sheet has increased in lockstep, reaching 33% of US GDP.

US public debt and Fed balance sheet relative to GDP


Source: Bloomberg

Yet, thanks to low interest rates, the cost of this rising debt to the US government has remained low and is indeed one third lower today than it was in the 1980s or 1990s (measured relative to share of GDP or tax revenue).

Interest cost of US public debt


Source: Bloomberg

But one may argue that low interest rates are a thing of the past and that going forward, the cost of servicing US debt will rise. To this, I refer readers to the previous instalment of this series where I discuss why interest rates cannot stay at current levels for long. The rising cost of government debt is just one more argument for why higher interest rates are a highly unlikely outcome in my view.

Of course, one possible outcome could be that investors lose trust in the US government’s ability to pay back its debt and thus demand a higher risk premium on long-term government bonds. This would be a development similar to the doubt about Greece’s ability to service its debt that triggered the European debt crisis of 2010 and 2011. As you may recall, this crisis was solved by the central bank buying government bonds in potentially unlimited amounts and artificially forcing long-term government bond yields lower to keep debt costs low.

And guess what, this is what the Fed could do as well, should investors start to demand a higher risk premium on US Treasuries.

Let me correct that. This is what the Fed has done for the last decade.

If you look at the first chart of this post, you will find that since 2008, the Fed’s balance sheet has grown in lockstep with government indebtedness. Though the Fed hasn’t explicitly monetised US government debt, it has effectively done so through its open market operations.

And this is where the case of Japan becomes relevant. I like to say that if you want to know our future, look at Japan. The Japanese government has a level of debt that should have led to a catastrophe long ago. Yet, they are still going, twenty years after Japan’s debt/GDP levels hit the heights the US has reached today. And if you are worried about the Fed’s balance sheet being large, take a look at the balance sheet of the Bank of Japan which is now not 33% of GDP as for the Fed, but 131% of GDP. The BOJ has been monetising Japanese government debt for three decades now without any negative consequence for government debt or without creating runaway inflation (in case you are wondering, Japanese inflation currently runs at 3%, compared to 4% in the US).

In fact, Japanese monetary policy is explicitly targeting 10-year government bond yields in order to keep long-term interest rates low and stimulate more demand and higher inflation. Without any success so far and few signs that this is going to change anytime soon. Growth and inflation remain stubbornly low in Japan despite the Bank of Japan monetising government debt for the better part of 30 years.

Japanese public debt and BOJ balance sheet relative to GDP


Source: Bloomberg

People who are expecting a debt catastrophe in the US have to explain, why the Fed could not do the same in the US as the Bank of Japan has done for decades there. There are commonly three arguments for why the case of Japan is a special case and why US government debt has to come crashing down.

The first argument is that monetising debt will lead to runaway inflation and hyperinflation. I have argued many times that this kind of quantity theory of money is nonsense (see here or here, for example). But even if you don’t believe me at that point, you have to explain why printing money for three decades has not created runaway inflation in Japan.

This is where people argue that Japanese government bonds are held mostly by Japanese people, not foreigners. Foreigners are more likely to lose trust and sell government bonds if they feel they are too risky. This is correct, which is why countries other than the US need to have fiscal discipline and cannot engage in reckless lending and uncovered deficit spending. The market turmoil after the UK’s mini budget under Prime Minister Liz Truss in September 2022 should be enough warning to governments around the globe that they cannot simply slash taxes and hope that this will create enough growth to offset the lost revenue. Governments have to provide a reasonable plan to show how deficits can be kept within limits.

This is why the EU enforces its stability criteria of a budget deficit no larger than 3% of GDP. But why can the US get away with much larger deficits for years and decades? Because it issues the world’s reserve currency and foreigners have to hold the US Dollar, whether they like it or not. As long as that is the case, foreigners will hold US Treasuries and not abandon them in any meaningful amount. And if you think that China could just crash US treasuries by dumping its holdings in the market or foreigners could abandon the US Dollar as a reserve currency, please read the instalment in this series on why that is complete nonsense.

Finally, the third argument I hear a lot about why Japan can survive with massive debt loads without risking default is its demographics. The argument is that because the Japanese population is so old and old people hold more bonds, the demand for government bonds remains high and the government can always rely on having enough buyers for its debt. Well, the demographic challenges of Japan are enormous, but I would argue that the US and Western Europe don’t look that much different. The chart below shows the share of the population aged 65 and older. These are the people who are supposed to hold more bonds as a safe asset. Note how with the retiring baby boomer generation the US is now experiencing an explosion in old age population share and that supposedly means that the demand for US Treasuries will increase rapidly and remain high for decades to come.

Share of population aged 65 or older


Source: United Nations Population Division

To summarise, I find the arguments that the US is facing a debt bomb that will either lead to government default or runaway inflation very unconvincing. The example of Japan shows that much higher levels of debt than what the US or Western European countries have today can be sustained for decades, so if anything, a debt crisis is a very long time in the future. And the case study of the UK mentioned at the beginning shows that the day of reckoning may in fact be centuries in the future.

Central banks have and in my view will continue to monetise government debt to keep long-term bond yields low if they have to. People who are afraid that this may create runaway inflation have to explain why this was not the case in Japan over the last three decades. The ageing demographics in the US and Western Europe even help governments in keeping demand for their bonds high and reduce the need for central bank intervention. And in the US, there is additional support from the fact that the US Dollar is the world’s reserve currency and foreign investors have to hold US Treasuries, whether they like it or not.
 
Our future is Japan
I like to tell people who are concerned about the large amount of debt we have floating around in the global economy that if they want to know how the future looks like, they have to look at Japan. In Western Europe and North America, we are essentially following in Japan’s footsteps. During this year’s Jackson Hole central banking conference, my view was reinforced by an analysis by economic historians Serkan Arslanalp and Barry Eichengreen.

In their research, they looked at how advanced and emerging economies managed to reduce large debt overhangs after wars and other calamities.

The chart below shows how advanced economies did it after World War II. At the end of the war, the average debt/GDP-ratio of advanced economies was 112%. Thirty years later the average debt/GDP-ratio had dropped to a mere 26.2%. Primary surpluses (i.e. budget surpluses before interest costs on existing debt) helped take the debt level down by 33.3% of GDP. That sounds a lot, but it was almost entirely offset by stock flow adjustments (SFA in the chart below) of 27.7% of GDP. These stock flow adjustments are the combined effect defaults and restructurings, nationalisation of private debt after the war and exchange rate effects from exchange rate devaluations.

Debt reduction in advanced economies after WWII

Source: Arslanalp and Eichengreen (2023)

Essentially all the debt reduction came from a negative r-g. r-g is the difference between real interest rate paid on debt and the real GDP growth of the economy. If r is smaller than g, the economy slowly grows out of its debt over time. And for much of the three decades after World War II that is essentially what happened. GDP growth was strong and financial repression through a combination of interest rate caps and high inflation led to low real rates.

But that was then, and this is now.

Arslanalp and Eichengreen look at the drivers of the debt reduction this time around and come to similar conclusions as I do.

They say that a primary budget surplus is only possible if a country can unite behind a policy of lower government spending or if a bond market crisis forces it to do so. I agree with their assessment that in our divided political landscape a national consensus about government spending and the need for primary budget surpluses is something seen only in countries where pigs can fly. Hence, budget surpluses will not be of any help in the coming decade unless politicians are disciplined by a bond market crisis.

And no matter what the Institute of Economic Affairs or columnists of The Telegraph will have you believe; this is what happened almost exactly a year ago in the UK. In reaction to mini budget of Liz Truss, which essentially amounted to large deficits now at the hope of more growth later, bond markets threw a major tantrum and started to treat the UK like it does emerging markets like Brazil when they engage in irresponsible fiscal policies. When a country is running large amounts of debt, no matter how developed or safe it is considered in normal times, it takes very little to shake the confidence of bond investors and create a bond market crisis that forces the government into a U-turn.

Is it any wonder that not only the current Conservative government insists on fiscal prudence but that the opposition Labour Party emphasises everywhere and all the time that it will not spend money they don’t have and not increase the deficit? This of course drives left-wing columnists at the Guardian mad, but it is exactly what needs to happen. Governments saddled with large amounts of debt have to be fiscally prudent or bond investors will force them. As James Carville famously said in reaction to the Great Bond Massacre of 1994: “I would like to come back as the bond market. You can intimidate everybody.”

But fiscal prudence does not mean governments will run large budget surpluses. Because the debt is so large, getting a budget into a primary surplus would mean substantial tax increases and (not either or, but as well as) spending cuts in important areas such as social security, pensions or defence, something that no party is willing to do. Thus, we are trapped in a world of small fiscal deficits or at best balanced budgets, neither of which will reduce debt in the long run.

Second, Arslanalp and Eichengreen note that there are different ways to reduce the real rate of interest r below the real rate of growth g. However, with our demographic headwinds, real economic growth is going to be lower than after World War II when rebuilding Europe and Asia after the destruction of the war added a boost to real GDP growth.

So, how do we get the real rate of interest below a low rate of real GDP growth?

One way to do that is to let inflation run above the nominal rate of interest. This can be done for short-term bonds which are essentially determined in the nominal interest as set by the central bank. But longer-term debt is priced in the bond market and there, bond yields will inevitably drift higher if investors expect inflation to remain high. Hence, only unanticipated inflation like the inflation spike we saw in 2022 is able to reduce government debt/GDP-levels in the long run. Any inflation that is anticipated will simply drive-up borrowing costs for governments without any long-term reduction in debt/GDP.

Unless, of course, the government is able to control the level of nominal interest rates for long-term debt. And this is where I slightly disagree with Arslanalp and Eichengreen. They say that in a world of globalised finance and free capital flows, governments that try to impose a limit on interest rates charged on long-term debt like they did in the 1950s to early 1980s will face a flight of capital and a bond market crisis. This is true in a free market view of the world. But if you look at Japan, you can see how that problem can be avoided via the central bank. In Japan, the central bank has been manipulating the bond market through its interest rate targeting policy for years. This has kept long-term bond yields close to zero and helped the government sustain debt levels well in excess of 200% of GDP.

In a week from today I will discuss in detail how I think monetary policy can be conducted going forward in order to ensure that real bond yields will remain below real growth rates even if growth is very low. So, keep an eye out for that one and set an alert for 12 September.

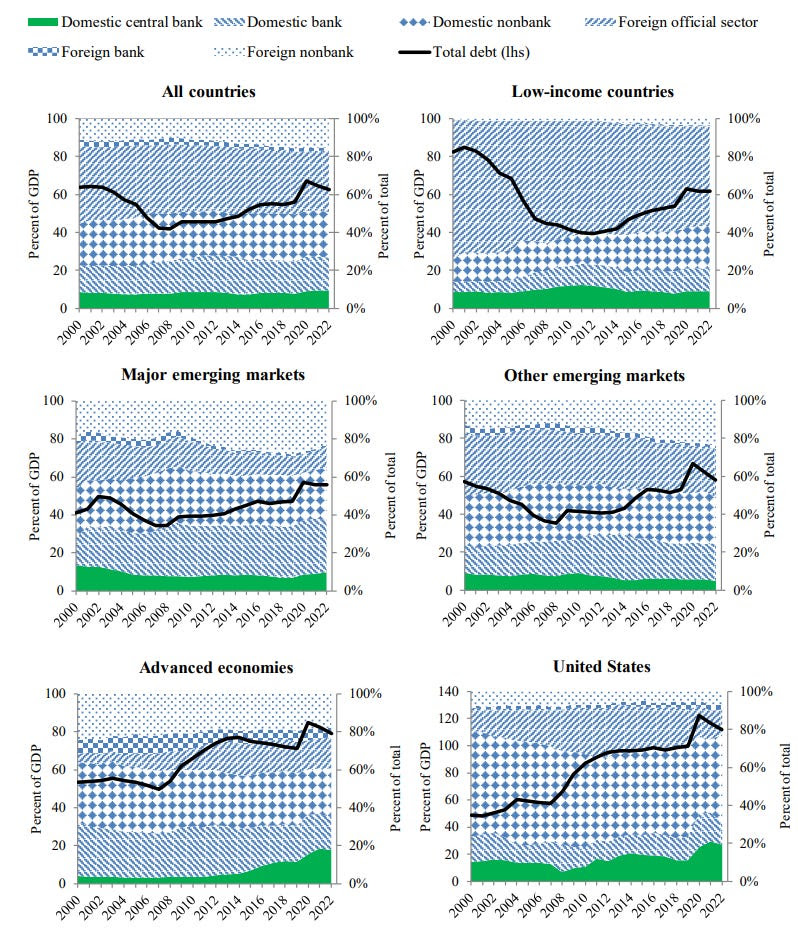
But of course, the argument of free capital flows still stands. Investors in Japanese bonds may be happy to get zero yield on long-term bonds, but would investors in US Treasuries or British Gilts and for it? In particular, would Chinese holders of US Treasuries not sell them and tank the Treasury market? This is where a chart from the paper of Arslanalp and Eichengreen is instructive. It shows who owns government debt in advanced economies and developing markets as well as the US. And if you look at these charts, you will find that foreign governments have already substantially reduced their holdings in US Treasuries for more than a decade. Yet, nothing happened because all that was necessary was for the central bank to step in and buy what foreigners don’t want to own anymore. It is a systematic monetisation of government debt by the central bank, and it is anything but a market that determines the price of debt freely. But it is what has happened and will continue to happen as long as we have these large amounts of debt. And no matter how much anyone complains about that, it is what in my view will happen because if it doesn’t happen, we will have the biggest financial crisis ever recorded in human history. And as I have said in my series on Cassandras: What cannot happen will not happen.

Ownership structure of government debt

Source: Arslanalp and Eichengreen (2023)
 
Is this the monetary policy of the future?


My series against Cassandras has inspired many interesting discussions with readers and I have already addressed two responses in posts before my summer hiatus. But one particularly interesting challenge came from reader JS. He took my argument that central banks have to follow in the footsteps of Japan because the high indebtedness of governments forces them to keep bond yields low to prevent a government debt bomb from exploding and asked a simple but powerful question: Assume you have a government with lots of debt and a central bank that uses QE to keep the cost of borrowing and bond yields low. Surely, they will have to abandon QE when there is an external inflation shock like we have seen in 2022?

Theoretically, that seems true. You would not want to fight inflation by hiking short-term interest rates while stimulating the economy by buying long-term bonds through QE measures. That’s like taking away with the left hand what the right hand gives.

But if you have a government that is extremely indebted, that may just be what a central bank has to do to prevent the system from collapsing.

Let me explain.

First, let us look at the central bank in the government with the highest indebtedness and its actions during the current inflation episode. In reaction to the inflation spike of 2022, the Bank of Japan did nothing.

National inflation rates arguably didn’t rise to the same heights as in the US or Europe, but by Japanese standards, the country experienced a pretty bad inflation push with annual inflation rates moving from -1% in mid-2021 to 4.1% at the end of 2022. Yet, the Bank of Japan did not hike interest rates. It didn’t even abandon its yield targeting policy where it fixes long-term bond yields. All it did was to allow bond yields to fluctuate in a wider band around the target and it even accelerated the pace of its bond-buying programme.

This is of course a different inflation scenario than the 10% inflation rates we saw in the US and much of Europe, so I would expect central banks in the West to hike interest rates in response to an external inflation shock just like they did in 2022. And they will do so even in an environment where government debt is very high.

But remember why central banks hike interest rates in the first place. They want to reduce demand in the private sector, not necessarily demand in the government sector.

This makes me wonder if central banks in a heavily indebted country could even go one step further. Could central banks reduce demand in the private sector by hiking short-term interest rates while protecting governments from rising interest payments by keeping long-term bond yields low? Would hiking interest rates at the short end while implementing QE at the long end of the yield curve work?¹

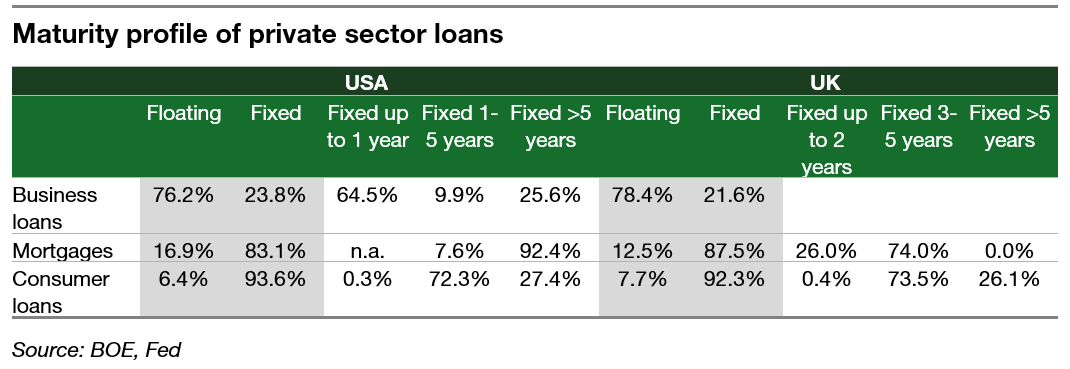
Obviously, nobody knows for sure but here is my main argument why I think this could work. The duration of debt in the private sector is much shorter than it is for the governments. Thus, interest payments for mortgages, consumer loans, and business loans adjust much quicker than the interest payments the government has to make on its bonds. The result would be that the private sector will experience a slowdown of demand well before the government faces significantly higher interest expenses that could push the deficit into an ever-accelerating spiral.

Let’s take a look at the situation in the UK and the US as an example.

It’s immediately clear that the average duration of consumer loans and business loans in the US and the UK must be less than 5 years because the vast majority of loans have a maturity below that. In the UK, where 5-year fixed mortgages are the norm even the average duration of a mortgage is below 5 years while in the US with its dominant 30-year mortgage the average duration is much higher.

But now let’s look at the average duration of government bonds issued by the UK and US governments. We exclude short-term financing vehicles with less than one-year maturity and end up with an average duration of government bonds in the US of 6.2 years and 9.1 years in the UK. In other words, it takes several years longer for the government to feel the pain of higher interest expenses than for the private sector.

It looks like it could be a viable monetary policy strategy to dramatically² increase short-term interest rates while keeping long-term bond yield low through yield curve targeting. Then, you just sit there and wait. The pain will first be felt by businesses and private households which have to curb demand, triggering a recession and killing off inflation. Only with some delay will the government's cost of debt increase. If the central bank is aggressive in hiking short-term rates, it can effectively trigger a recession and put out inflationary fires before the government even feels material pain on the debt front.

Effectively, this would bail out a heavily indebted government while still allowing the central bank to target inflation and employment levels.

I invite readers to comment on this idea, but it seems to me this could be the get-out-of-jail card for heavily indebted governments…

1
Here it is worth mentioning that there is a common misunderstanding of the link between QE and inflation. If a central bank continues to buy bonds at unchanged speed this does not add fuel to the inflationary fire. What matters is the rate of change in the bond-buying programme. If the central bank increases the amount of bonds bought in the open market that is supposed to increase inflation while a reduction of bond purchases is supposed to reduce inflation.
2
The central bank would likely have to increase short-term rates more aggressively than normal because the long end of the yield curve is fixed by QE meaning that some of the pain from higher short-term rates will not be transmitted to the long end of the yield curve making harsher rate hikes on the short-end necessary to get the same impact on the real economy.
 
Japan is the playbook, not the exception
Last year, one part of my series against Cassandras focused on the fear of excessive government debt in the US and other countries. I explained why current debt levels will not lead to a debt catastrophe or a financial crisis anytime soon and I emphasised that Japan manages to sustain much, much higher debt levels for decades without problems. Furthermore, I showed how central banks can engage in financial repression to help governments sustain extremely high debt levels forever. A new study provides some wonderful analysis of how this works in practice in Japan.

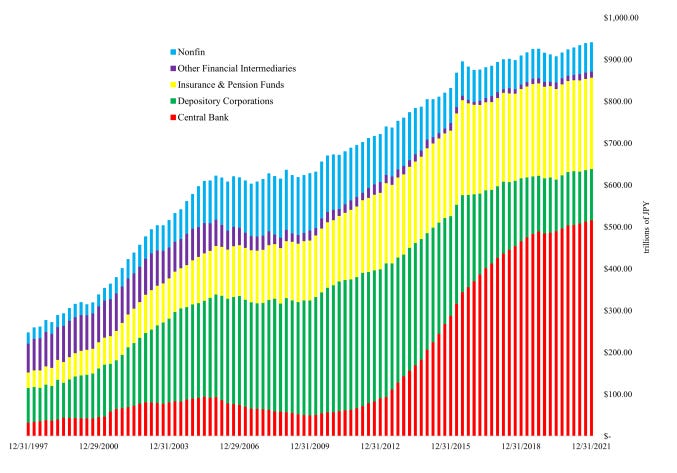
Let’s start with a look at who owns Japanese government bonds (excluding T-Bills and other money market instruments). Note the dramatic increase in the share of bonds owned by the Bank of Japan which launched its quantitative easing in 2001 but then turbocharged it after the financial crisis. Key to this massive increase in bond holdings by the central bank was the zero interest rate policy and the introduction of yield curve control, where the central bank stands ready to buy any government bonds as soon as yields drift above a certain threshold. In essence, the Bank of Japan guarantees the government that it will buy government debt at low yields, which is the same as saying it will buy government debt at (excessively?) high prices.

Japanese government bond holdings (excluding T-Bills)


Source: Chien et al. (2023)

Now, put yourself into the shoes of the Bank of Japan. The central bank’s balance sheet is invested in long-duration assets (i.e. Japanese government bonds) but its liabilities are defined by the reserves, commercial banks hold at the central bank and the currency in circulation. In other words, the central bank earns long-term interest rates and pays short-term interest rates or no interest at all on its liabilities. That is not different from what regular banks do by lending money to households and businesses with long duration but borrowing money in the form of deposits with short duration. Except that the central bank doesn’t really need to borrow money to finance its operations (remember, a central bank does not have double bookkeeping because it can print money at will to cover any losses or deficits, which is also why a central bank cannot go bankrupt).

While this kind of borrowing short to lend long is the essence of classic banking, the central bank can do this at levels that are much more extreme than what any commercial bank could do. Today, the Bank of Japan owns Japanese government bonds to the tune of 131% of Japanese GDP. Hence the government of Japan continues to borrow at low interest cost but with very long duration while the liabilities remain relatively short duration.

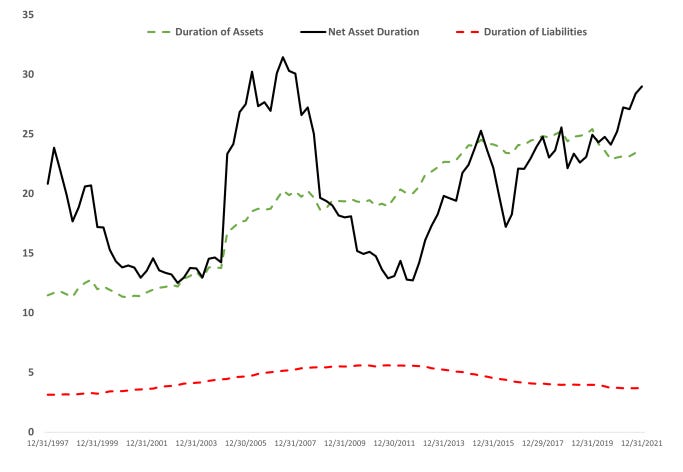
If one combines the government balance sheet with the Bank of Japan balance sheet, one can calculate the duration of assets and liabilities as well as the net duration of the government’s assets. As you can see from the chart, this net duration rose from 10 years in 2011 to 30 years today.

Duration of Japanese government (incl. Bank of Japan) balance sheet


Source: Chien et al. (2023)

In the study, the authors estimate that this kind of recycling of government debt via the central bank’s QE and yield curve control is likely to reduce government bond yields by about two percentage points and enables the Japanese government to not only sustain high debt levels indefinitely but to increase its borrowing capacity while servicing all existing liabilities. The financial repression by the Bank of Japan is so strong that it enables the Japanese government to pile on more and more debt without ever getting into trouble.

This has two important consequences.

First, the larger the duration mismatch between assets and liabilities becomes for the government, the stronger the incentive to keep interest rates low. You see, if the duration mismatch between assets and liabilities is large, then rising interest rates will lead to a massive financing problem for the government because its assets lose value much faster than its liabilities. However reducing interest rates leads to an outsized financing headroom for the government, so every government has a large incentive to influence the Bank of Japan to keep yield curve control in place and force long-term bond yields to very low levels forever.

Second, the artificially low yields on long-term government bonds mean that there is a redistribution of wealth towards owners of assets with long duration. These tend to be older and wealthier households who own homes and have larger investment portfolios. Younger and poorer households, on the other hand often must borrow at high interest rates with short maturities or have no investment portfolios and thus only earn short-term interest rates on their bank accounts. The result is that as financial repression continues to keep the government afloat, wealth is gradually shifted towards older and wealthier households which may lead to social tension in the long run.

I think it is crucial for investors today to understand these dynamics because as I keep emphasising, our future is Japan. In the US and Western Europe, the joint challenge of an ageing society and large debt levels forces us to follow in the footsteps of Japan. Expect the charts above to become the playbook for the US and Western Europe over the coming decades.
 
Mi piace riscontrare questa tua domanda su un aspetto particolare, che riguarda la piu' classica delle domande che si pone un giovane che vuole imparare a diventare un trader oppure ad ambire allo status di investitore esperto.

La domanda che ha assillato generazioni di neofiti folisti e' sempre stata da decenni la seguente: meglio l'analisi tecnica oppure l'analisi fondamentale per iniziare a guadagnare in borsa ?

Come molti di voi sanno, in passato mi sono occupato per decenni con il signor Ernesto nel tentativo di demolire l'analisi tecnica in ogni suo aspetto metodologico, invitando molti degli aspiranti trader analizzatori tecnici a spostarsi in questa sezione che - assieme al signor Ernesto - abbiamo creato tantissimi anni fa.

Finita quell'esperienza di confutatore delle alchimie quali testa e spalla, orecchi di Batman, tazze con il manico, oggi non mi occupo piu' neppure di econometria. Caomai, desidererei essere impegnato nel tentativo di ridimensionare l'importanza dell'analisi fondamentale in cui tanti anni fa avevo, ingenuamente, credito.

Ecco cosa ne penso in proposito con la raggiunta maturita'.


L'analisi fondamentale rappresenta un metodo di valutazione di investimento largamente utilizzato, basato sull'analisi dei dati finanziari e delle caratteristiche intrinseche di un'azienda. La sua efficacia varia in base alla tipologia di azienda in esame. Cerco di dare un quadro minimale di riferiemnto.

Aziende industriali, manifatturiere e di servizi di medie dimensioni:

In questo contesto, l'analisi fondamentale si dimostra utile per l'investitore "buon padre di famiglia". Le caratteristiche di queste aziende, quali business tradizionali, crescita solida e dimensioni contenute, le rendono facilmente analizzabili attraverso i principi dell'analisi fondamentale. L'investitore, grazie a questa metodologia, può ottenere un vantaggio informativo significativo rispetto al mercato, identificando potenziali sottovalutazioni o sopravvalutazioni.

Aziende di grandi dimensioni:

Con l'aumentare della dimensione aziendale, l'importanza dell'analisi fondamentale tende a diminuire. La complessità di queste realtà, spesso caratterizzate da molteplici divisioni, filiali e operazioni su scala internazionale, rende difficoltosa un'analisi completa e accurata da parte del singolo investitore. Inoltre, fattori esterni come la politica nazionale oppure i crescenti diktat europei assumono un peso maggiore nel determinare il valore di queste aziende.

Aziende internazionali di grandi dimensioni:

Per aziende come Tesla, Nvidia, Stellantis e simili, l'analisi fondamentale si rivela pressoché inutile per l'investitore "buon padre di famiglia". La rapidità con cui i prezzi di mercato incorporano le informazioni disponibili rende quasi impossibile l'identificazione di distorsioni tali da generare un rendimento superiore al mercato.


La sistematizzazione teorica di questa mia visione particolare si trova nel modello antediluviano di Fama sull'efficienza dei mercati, che distingue tre livelli di efficienza:

  1. Efficienza debole: I prezzi di mercato riflettono tutte le informazioni contenute nei prezzi passati.
  2. Efficienza semiforte: I prezzi di mercato riflettono tutte le informazioni pubblicamente disponibili.
  3. Efficienza forte: I prezzi di mercato riflettono tutte le informazioni, anche quelle non pubblicamente disponibili.
Secondo il modello di Fama, all'aumentare del livello di efficienza del mercato, l'analisi fondamentale diventa meno efficace nel generare sovraperformance.

In conclusione:

L'analisi fondamentale rimane uno strumento prezioso per l'investitore "buon padre di famiglia", ma la sua efficacia varia in base alla tipologia di azienda. Per aziende di medie dimensioni con caratteristiche di solidità e crescita, l'analisi fondamentale può apportare un valore significativo. Al contrario, per aziende di grandi dimensioni e, in particolare, per quelle statunitensi, le famose 7 sorelle con capitalizzazioni stellari, l'analisi fondamentale risulta di nessuna efficacia, con l'investitore che difficilmente può ottenere un vantaggio informativo rispetto al mercato.

Ti ringrazio e mi ricollego a questa sintesi che trova riscontro in quanto ho potuto approfondire nel tempo.

Parto da una considerazione sull'analisi tecnica e quindi dall'efficienza debole:
I prezzi di mercato riflettono tutte le informazioni contenute nei prezzi passati.
Tempo fa ho letto un commento di Gunnar Miller, un gestore con 40 anni di esperienza nel campo della ricerca.
Negli anni 80 lavorava tra gli altri presso Morgan Stanley. Ancora giovane e con i punti di riferimento accademici ben presenti (tra i quali anche quelli da te citati) un giorno chiese ad un collega più anziano per quale motivo ci fosse una stanza riservata ad un team che non faceva altro che tracciare linee su carta millimetrata ricercando pseudocorrelazioni visive; allo stesso modo di quando vediamo grafici sovrapposti dell'sp500 di 2 periodi diversi che partono da un punto arbitrario e casualmente sembrano seguire lo stesso andamento, con la pretesa di poter prevedere il futuro sulla base dei movimenti passati.
La risposta fu che anche sul New York Times si parla di oroscopi, e si dà in pasto quello che la gente vuole leggere.
Come ho già scritto altrove questa storiella sottolinea due punti importanti:

  • il fatto di aver lavorato a wall street non è condizione sufficiente a fare di quella persona un reale esperto.

  • Il secondo punto è che anche se volessimo dare valore al concetto che l'analisi tecnica è valida come profezia autoavverante perchè ci sono milioni di individui che la seguono il problema è che:
  1. al contrario di quando l'analisi dei grafici è nata, oggi, se presenti, le occasioni vengono colte da chi ha i mezzi per farlo anche e soprattutto dal punto di vista delle commissioni (vedere i box spread su SPX e eminisp500 e gli arbitraggi sul tasso implicito nella settimana di rollover del future)
  2. le figure tecniche sono come il test di Rorschach, ognuno ci vede quello che vuole. E più le figure sono complesse, maggiore è la difformità di vedute. Quindi affidarsi ad una analisi grafica sempre più elaborata significa andare esattamente nella direzione opposta rispetto al principio che vorrebbe l'analisi tecnica guidata dalla "coscienza collettiva". La coscienza collettiva agisce su principi semplici, ed anche se fosse si ritorna comunque al punto uno.
  3. L'eventuale backtesting di tali figure dovrebbe essere fatto costruendo delle serie storiche. E fondamentalmente ricercando correlazioni su cui costruire regressioni da cui trarre scenari probabilistici. Il problema di questo approccio sulle serie storiche è che risulta limitato dai stringenti presupposti su cui si basa questo tipo di analisi statistica. (come già evidenziato qui: Don’t Always Trust Regression and Correlation in Finance: Here’s Why
  4. Questa è più una boutade logica: tutte le metodologie di prezzo delle opzioni si basano su modelli che incorporano l'efficienza del mercato, almeno quella debole e che quindi considerano inutile ai fini della probabilità degli scenari futuri tutto quello che è accaduto nei momenti precedenti all'attuale (l'ho fatta molto semplice, chiedo scusa) che è l'opposto di quanto definito nell'analisi tecnica. Utilizzare analisi tecnica e greche nelle proprie decisioni di trading rappresenterebbe una contraddizione di base.

Riguardo l'analisi fondamentale appena riesco riporterò dei riferimenti a lavori molto interessanti che potranno chiarire ulteriormente le difficoltà da parte dei gestori a far meglio del benchmark, in particolare l'SP500 e le sue caratteristiche (seconda parte della spiegazione del bias rialzista degli indici azionari).
 
  • Like
Reazioni: Mei
Ti ringrazio e mi ricollego a questa sintesi che trova riscontro in quanto ho potuto approfondire nel tempo.

Parto da una considerazione sull'analisi tecnica e quindi dall'efficienza debole:
I prezzi di mercato riflettono tutte le informazioni contenute nei prezzi passati.
Tempo fa ho letto un commento di Gunnar Miller, un gestore con 40 anni di esperienza nel campo della ricerca.
Negli anni 80 lavorava tra gli altri presso Morgan Stanley. Ancora giovane e con i punti di riferimento accademici ben presenti (tra i quali anche quelli da te citati) un giorno chiese ad un collega più anziano per quale motivo ci fosse una stanza riservata ad un team che non faceva altro che tracciare linee su carta millimetrata ricercando pseudocorrelazioni visive; allo stesso modo di quando vediamo grafici sovrapposti dell'sp500 di 2 periodi diversi che partono da un punto arbitrario e casualmente sembrano seguire lo stesso andamento, con la pretesa di poter prevedere il futuro sulla base dei movimenti passati.
La risposta fu che anche sul New York Times si parla di oroscopi, e si dà in pasto quello che la gente vuole leggere.
Come ho già scritto altrove questa storiella sottolinea due punti importanti:

  • il fatto di aver lavorato a wall street non è condizione sufficiente a fare di quella persona un reale esperto.

  • Il secondo punto è che anche se volessimo dare valore al concetto che l'analisi tecnica è valida come profezia autoavverante perchè ci sono milioni di individui che la seguono il problema è che:
  1. al contrario di quando l'analisi dei grafici è nata, oggi, se presenti, le occasioni vengono colte da chi ha i mezzi per farlo anche e soprattutto dal punto di vista delle commissioni (vedere i box spread su SPX e eminisp500 e gli arbitraggi sul tasso implicito nella settimana di rollover del future)
  2. le figure tecniche sono come il test di Rorschach, ognuno ci vede quello che vuole. E più le figure sono complesse, maggiore è la difformità di vedute. Quindi affidarsi ad una analisi grafica sempre più elaborata significa andare esattamente nella direzione opposta rispetto al principio che vorrebbe l'analisi tecnica guidata dalla "coscienza collettiva". La coscienza collettiva agisce su principi semplici, ed anche se fosse si ritorna comunque al punto uno.
  3. L'eventuale backtesting di tali figure dovrebbe essere fatto costruendo delle serie storiche. E fondamentalmente ricercando correlazioni su cui costruire regressioni da cui trarre scenari probabilistici. Il problema di questo approccio sulle serie storiche è che risulta limitato dai stringenti presupposti su cui si basa questo tipo di analisi statistica. (come già evidenziato qui: Don’t Always Trust Regression and Correlation in Finance: Here’s Why
  4. Questa è più una boutade logica: tutte le metodologie di prezzo delle opzioni si basano su modelli che incorporano l'efficienza del mercato, almeno quella debole e che quindi considerano inutile ai fini della probabilità degli scenari futuri tutto quello che è accaduto nei momenti precedenti all'attuale (l'ho fatta molto semplice, chiedo scusa) che è l'opposto di quanto definito nell'analisi tecnica. Utilizzare analisi tecnica e greche nelle proprie decisioni di trading rappresenterebbe una contraddizione di base.

Riguardo l'analisi fondamentale appena riesco riporterò dei riferimenti a lavori molto interessanti che potranno chiarire ulteriormente le difficoltà da parte dei gestori a far meglio del benchmark, in particolare l'SP500 e le sue caratteristiche (seconda parte della spiegazione del bias rialzista degli indici azionari).

Grandi contributi, grazie a te e al sempre ottimo P.A.T.

Provo ad aggiungere la mia iniziando dal confermare che "il fatto di aver lavorato a Wall Street non è condizione sufficiente a fare di quella persona un reale esperto" e lo dico per esperienza personale. Forse modificherei la parte finate con "fare di quella persona un trader vincente" perchè probabilmente, anche solo per osmosi, in una certa misura "esperto" lo è diventato: esperto ad evitare gli errori più evidenti, esperto nel porsi di fronte a determinati problemi, esperto nel gestire le situazioni e le posizioni.

Io, che mi definisco un operaio della finanza, nel senso che non sviluppo progetti o sistemi o modelli o teorie, ma che semplicemente faccio girare le macchine, i soldi e le operazioni (e lo faccio da ormai quasi 30 anni) mi dichiaro, come già in passato "Ateo rispetto all'AT" ma mi prendo uno spazio aggiuntivo. Lascio stare i modelli più complessi ma guardo le tecniche più semplici cercando di sfruttare una micro inefficienza: state pur tranquilli che in un mercato bear tutti i gestori si terranno un cippino da buttare al test della media 100 e 200. Così come su un doppio massimo ridurranno di un terzo le posizioni su una certa azione. Questo non da vantaggi previsionali, non da garanzie ( ... ), non supporta un cambiamento di trend ma, se sfruttato con attenzione e rapidità come P.A.T. spesso riesce a fare, fornisce almeno una motivazione quasi razionale per un trade che altrimenti verrebbe definito "istintivo".

Sulla analisi fondamentale sono più possibilista, ma il mondo è cambiato e la AF che si insegna nelle università si confronta con temi e rapidità e concetti ormai diversi.

Vi garantisco, visto che la leggo assiduamente, che la ricerca dei fair value che si fa nelle case di brokeraggio ha fatto in 5/6 anni passi da gigante in avanti. Ormai ci sono modelli non solo sui settori, ma diversi anche per le singole aziende. Le domande, molto più che dei soliti modelli di valutazione, sono sulla sostenibilità del trend. Quindi gli analisti che lavorano sui fondamentali per conto delle case di investimento sono estremamente "avanti" sui modelli fondamentali.

Che la AF classica sia in difficoltà lo dimostra l'esperienza di Damodaran sui mercati: da docente della NY University ha rivoluzionato la moderna valutazione delle aziende, i suoi libri sono alla base dei corsi universitari e post-universitari con merito. Ciò nonostante non è stato in grado di replicare il successo nelle valutazioni destinati ai mercati azionari e alle aziende quotate. Ricordo un caso estremo in cui disse valutando AMAZON con i criteri delle aziende della grande distribuzione disse credo nel 2018 che non poteva più salire perchè avrebbe saturato il 100% del mercato US.

L'impatto della tecnologia in generale e della ricerca avanzata non è banale da valutare e molti si ostinano a guardare il dettaglio di ieri piuttosto che le opportunità di domani. Un esempio classico è NVIDIA che avete citato che per alcuni "fondamentalisti old style" è una follia, ma io cerco di basarmi su considerazioni diverse ma cmq oggettive. L'esempio puntuale del potenziale di NVIDIA a mio avviso viene da Masayoshi Son di Softbank quando afferma che, per arrivare a fare concorrenza vera a Nvidia tra 5 anni e partendo da ARM ci sarà bisogno di 100 miliardi di investimenti. Quindi ARM che vale 130 miliardi + 100 miliardi di cash mi porteranno forse a raggiungere NVDA tra 5 anni sperando che ci aspetti. O capire perchè NVDA fattura 60 miliardi con 22k di dipendenti mentre INTC fattura 54 miliardi con 125k dipendenti... O capire perchè l'Hardware di NVDA è alla base delle Tesla, del cloud, della IA ...

ll potere dell'intelligenza in senso ampio e la capacità visionaria di immaginare i percorsi futuri in molti settori contano più delle tradizionali regole di bilancio.

Questa è una tabella del capex del 2020 delle vecchie 4 big tech e dell'atteso 2025 solo per il cloud (e già il 2020 con il covid ha visto il tech fare tanti investimenti):
1712177533833.png


In questo contesto e con questo potenziale che senso fermarsi all'utile atteso per il 2023 o il 2024 di una azienda come Nvidia senza valutare l'ipotesi che potrebbe essere infinte volte più ampio nei prossimi 10 anni ?

Che premio dare sulle valutazioni aziendali basate sui metodi tradizionali alla leadership tecnologica ? e come essere capaci di stimare la persistenza nel tempo della stessa leadership ? è sufficiente avere buoni laureati in valutazione aziendale o finanza o servono schieri di ingegneri informatici ?

Come deve essere la nuova analisi fondamentale e che orizzonti dovrà avere ?

In cima alla convinction list di Goldman ci sono Nvidia e ASML, Nvidia è nel modello dal febbraio 2003 e ASML da settembre 2001.

In un paper decisamente old style GS inizia la sua copertura sui produttori di chip ed ecco cosa diceva su NVIDIA:

1712178268307.png
 
Grazie mille e mi ricollego ad alcuni spunti interessanti citati da te e prima ancora da P.A.T.


Parto da qui: "Lascio stare i modelli più complessi ma guardo le tecniche più semplici cercando di sfruttare una micro inefficienza: state pur tranquilli che in un mercato bear tutti i gestori si terranno un cippino da buttare al test della media 100 e 200. Così come su un doppio massimo ridurranno di un terzo le posizioni su una certa azione. Questo non da vantaggi previsionali, non da garanzie ( ... ), non supporta un cambiamento di trend ma, se sfruttato con attenzione e rapidità come P.A.T. spesso riesce a fare, fornisce almeno una motivazione quasi razionale per un trade che altrimenti verrebbe definito "istintivo"."

A questo proposito mi riferisco ad un famoso paper della banca di Inghilterra:

The dog and the frisbee

Catching a frisbee is difficult. Doing so successfully requires the catcher to weigh a complex array of
physical and atmospheric factors, among them wind speed and frisbee rotation. Were a physicist to write
down frisbee-catching as an optimal control problem, they would need to understand and apply Newton’s
Law of Gravity.
Yet despite this complexity, catching a frisbee is remarkably common. Casual empiricism reveals that it is
not an activity only undertaken by those with a Doctorate in physics. It is a task that an average dog can
master. Indeed some, such as border collies, are better at frisbee-catching than humans.
So what is the secret of the dog’s success? The answer, as in many other areas of complex
decision-making, is simple. Or rather, it is to keep it simple. For studies have shown that the
frisbee-catching dog follows the simplest of rules of thumb: run at a speed so that the angle of gaze to the
frisbee remains roughly constant. Humans follow an identical rule of thumb.
Catching a crisis, like catching a frisbee, is difficult. Doing so requires the regulator to weigh a complex array
of financial and psychological factors, among them innovation and risk appetite. Were an economist to write
down crisis-catching as an optimal control problem, they would probably have to ask a physicist for help.
Yet despite this complexity, efforts to catch the crisis frisbee have continued to escalate. Casual empiricism
reveals an ever-growing number of regulators, some with a Doctorate in physics. Ever-larger litters have not,
however, obviously improved watchdogs’ frisbee-catching abilities. No regulator had the foresight to predict
the financial crisis, although some have since exhibited supernatural powers of hindsight.
So what is the secret of the watchdogs’ failure? The answer is simple. Or rather, it is complexity. For what
this paper explores is why the type of complex regulation developed over recent decades might not just be
costly and cumbersome but sub-optimal for crisis control.

Un ragionamento applicabile alle strategie di investimento:
"a better fit of past data often means you start overfitting the past and your forecasting performance is becoming worse."

Ed è lo stesso motivo per il quale le strategie più semplici finiscono per essere quelle più efficaci
E qui mi riferisco al momentum che in teoria dovrebbe essere un concetto negato dall’efficienza del mercato.
Il punto è che all’efficienza del mercato ci credono solo i teorici delle università.
Alla base di questo paper c’è un esperimento:
Mental Models of the Stock Market
academics, financial professionals, retail investors, and members of the general public were invited to invest in different stocks or the stock market overall. The setup was quite simple. Investors were provided with good or bad news about a company that had been released four weeks ago. Then they were asked to predict the future return of that stock and interviewed about their reasons for making that forecast.
Essentially, the vast majority of academics followed the prescriptions of the efficient market hypothesis and did not change their forecasts in response to old news, good or bad. They argued that this information was fully reflected in the share price and hence has no impact on future returns.
Financial professionals, retail investors, and members of the public alike changed their return expectations in response to this news. If the news is good, they increase their return expectations even if that news item was released four weeks ago. If the news is bad, they reduce their return forecasts.
The main argument for doing so is the persistent impact of the news on future earnings and dividends. They argue that because of the good news, earnings growth should be stronger, which should result in higher share prices going forward, etc.

Il mercato lo fanno comunque gli investitori e non i professori e quindi le inefficienze tendono ad emergere.
E tali inefficienze possono derivare proprio da chi di professione dovrebbe determinare quei valori su cui il mercato dovrebbe cercare un equilibrio.
In questa ricerca:

A strategy that follows analysts’ herd-like behavior lets you know when it will be favorable to pile into Meta’s stock again

behavioral effects lead to ‘market inefficiencies’. One of these is herding and many studies have shown that analyst up- and downgrades of earnings do not happen in a vacuum. Rather, analyst up- and downgrades come in waves. And these waves influence share prices and create lasting price trends.
Quando il consenso su un titolo vacilla, le crepe tendono ad allargarsi ed a creare un’onda che sale progressivamente verso la parte opposta.

Questo si collega a quest’altro studio:
Why Does Operating Profitability Predict Returns? New Evidence on Risk versus Mispricing Explanations
Companies with high profitability are often referred to as ‘quality stocks’ because they consistently generate significant profits. This term contrasts with ‘junk stocks,’ which are associated with companies that are either unprofitable or have low profitability. The concept of a profitability premium, which suggests that more profitable companies tend to outperform less profitable ones in the stock market, was brought into the spotlight by Robert Novy-Marx.

The efficient market hypothesis would lead one to expect that the higher profitability of these companies would be factored into their stock prices, negating any additional returns for investors. However, this isn’t the case, as highly profitable companies typically outperform their less profitable counterparts. This raises the question of whether this outperformance is due to higher risks associated with profitable companies or if it’s a result of systematic market mispricing.

Anwer Ahmed, Michael Neel, and Irfan Safdar investigated this phenomenon and found that higher profitability does not equate to higher risk. In fact, their research indicated that highly profitable companies are less likely to experience significant share price drops. Moreover, during particularly negative months, shares of more profitable companies tend to perform better than those of less profitable companies, which would not be the case if the profitability premium were simply compensation for higher risk.

Analysts’ forecasts often play a significant role in this dynamic. They tend to underestimate the future profitability of successful companies and overestimate that of less successful ones. As financial analysts revise their estimates throughout the year, the share prices of highly profitable companies generally increase, while those of less profitable companies decrease.


Effetti simili si hanno a causa delle narrative su social e media che si sviluppano su determinati titoli sia al rialzo che al ribasso (pensare alle meme stocks):
Media Narratives and Price Informativeness


In particolare in questo paper Factor Zoo

si evidenzia che le differenze di rendimento medio tra titoli possono ridursi ad una ventina di fattori esplicativi tra cui:

Value factor, which is the ratio of intrinsic value to market cap. Essentially, that is the valuation of stocks as derived from a classic discounted cash flow model based on analyst expectations. It confirms that value is a crucial factor in understanding stock market returns.
There is the classic price momentum factor of share price returns from t-12 to t-1.
There is one quality factor in there, namely cash operating profits to book assets, a close relative of return on capital.
Finally, the quarterly sales growth of a company and the change in net operating assets.
 
"Vi garantisco, visto che la leggo assiduamente, che la ricerca dei fair value che si fa nelle case di brokeraggio ha fatto in 5/6 anni passi da gigante in avanti. Ormai ci sono modelli non solo sui settori, ma diversi anche per le singole aziende. Le domande, molto più che dei soliti modelli di valutazione, sono sulla sostenibilità del trend. Quindi gli analisti che lavorano sui fondamentali per conto delle case di investimento sono estremamente "avanti" sui modelli fondamentali."

Su questo ci ragiono da tempo:

Note by Gianni Berardi on Substack


The fair value estimate is a Morningstar analyst’s estimate of a stock’s intrinsic value, or what a stock is worth in the long term. Morningstar analysts use a proprietary discounted cash flow model to determine a stock’s fair value estimate.

The graph below shows the ratio price to fair value for the median stock in the selected coverage universe over time.

A ratio above 1.00 indicates that the stock’s price is higher than Morningstar’s estimate of its fair value. The further the price/fair value ratio rises above 1.00, the more the median stock is overvalued. A ratio below 1.00 indicates that the stock’s price is lower than Morningstar’s estimate of its fair value. The further it moves below 1.00, the more the median stock is undervalued
d4268b77-9527-43e9-99ec-4e45c1631bd5_729x921.png


Da questo punto di vista siamo lontani dalla salita del biennio covid
 
Sulla scorta di quanto detto ieri concludo il discorso (cosa che mi permette di chiudere anche l'approfondimento sul bias rialzista dell'sp500)
riporto questa volta dal blog market sentiment:

Why index investing works
For a company to be included in the S&P 500 index, it has to satisfy the following criteria

  • The company should be from the U.S, and shares should be highly liquid
  • Market cap > $8 Billion
  • Positive earnings in the recent quarter and positive total earnings in the previous year
The strategy is as simple as it gets. The index committee meets every quarter, reviews the companies on the existing list, and sees if there are any new companies that can replace the existing ones using the above 3 rules. That’s how Tesla entered the S&P 500 by replacing Apartment Investment and Management Co in December ’20.

If you look at it closely, the S&P 500 is a momentum strategy. They eventually cut companies that don’t grow at the rate of the market (companies that fall out of the list) and add companies that are growing above market rates, which become big enough to be included in the top 500 list.
1712316152622.png
****
80% of the stocks in the total stock market had a real return of 0% during the last 25 years. It's the other 20% that are driving the gains that we attribute to the market. The very nature of a market-cap weighted index means that the best companies eventually rise to the top and get added to the index, and the losers fall out. The cherry on top is that they let the winners ride as long as they are present in the top 500 list and are profitable!

The strategy works because they have remained consistent with it over the past five decades. The index committee does not change strategy based on what’s happening in the market. They don’t wake up one day and say, “you know what, tech stocks are booming, and we should pivot to tech” or “The Fed is planning to increase interest rates - we should cash out and wait for the dip” - They have consistently stuck with the strategy of just buying the 500 biggest profitable stocks in the market!

The power of persistence
Value Line Funds is a classic example of how hard it is to stick to a well-established strategy. The company has been around since the 1950s and runs one of the oldest mutual funds. But when the Wall Street Journal evaluated its performance back in 2005, they found something fascinating.

Value Line company runs two services. One is their investment survey which identifies top value stocks that you should invest in. The company also runs a mutual fund that follows a similar strategy. Investors who followed their stock picks had an amazing gain of 76% over a five-year period (inclusive of the dot com crash!), but those who invested in their mutual fund lost 19% during the same period.

The problem was that the fund never stuck to its own strategy and churned around its management team multiple times. The new managers, hoping to outperform the company’s strategy, dipped into stocks that were lower rated by the company’s own algorithm in the hope of finding “hidden gems” - The results were disastrous!
1712316274601.png


How to beat the market
If the market benchmark is based on “buy the biggest companies that are profitable”, shouldn’t we be able to do better by just going one or two steps deeper? That’s exactly what Jim O’Shaughnessy analyzed in his book What Works on Wall Street. He used stock market data from 1926 to 2009 to backtest strategies that reliably beat the market benchmarks.

He just added one more layer to the stock selection process, and the results were stunning:

1. Market Leaders: Invest in companies that are in the top half of the field - That is, greater than average in market cap, shares outstanding, cash flow, and sales. Market Leaders were able to give close to double the return of the S&P 500 while having slightly higher risk (Std deviation and Sharpe ratio). Intuitively, this strategy makes sense, as we are picking the best-performing companies from the biggest companies. Over the long term, this outperformance should be reflected in the stock price, and that’s exactly what we see below!

$10K invested in Market Leaders grew to $536K compared to only $288K if you had invested in the S&P 500.
1712316291811.png


Returns (1979 to 2009) Source: What Works on Wall Street
2. PE Ratio: If you want to know how irrational we all were in 2020-21, take a look at the following chart.

1712316310045.png

Drop from ATH once the Fed started raising rates
Most growth companies dropped like flies once the interest rates started going up. When you buy into companies due to an amazing story and an expectation of future growth, you are most likely bound to be disappointed in the end. O'Shaughnessy’s analysis proves the same - (emphasis added throughout, edited for clarity):

Both All Stocks (comparable to the Total Stock Market) and Large Stocks(comparable to the S&P500) with high PE ratios perform substantially worse than the market. Companies with low PE ratios from both the All Stocks and Large Stocks universes do much better than the universe. In both groups, stocks with low PE ratios do much better than stocks with high PE ratios. Moreover, there’s not much difference in risk. All the low PE groups provided higher returns over the periods, with lower risk than that of the universe. - Excerpt from What Works on Wall Street.
1712316345640.png

Returns (1964 to 2009) - Source: What works on Wall Street (Note - Earnings/Price decile 1 would be the stocks having the lowest Price/Earnings)
Most Wall Street and investment experts often use mental heuristics for making important investment decisions. When confronted with vast amounts of data, our brain has a funny way of taking shortcuts to help make decisions. This can be based on the story that we hear about the company, our personal bias towards the founders, or our experience with the product - and in most cases, we would be wrong!

The only way to overcome this is by not letting subjective judgments into our analysis and letting data guide us. Only the empirical relationships between data and the outcome must be used to reach conclusions.


****Notare che la legge di Pareto ritorna sempre, sia nel precedente post sul factor investing che in questo grafico, quel concetto che una grande parte delle differenze nei risultati è solitamente causata da un piccolo numero di fattori, il famoso 80/20
 
Ultima modifica:
Sulla scorta di quanto detto ieri concludo il discorso (cosa che mi permette di chiudere anche l'approfondimento sul bias rialzista dell'sp500)
riporto questa volta dal blog market sentiment:

Why index investing works
For a company to be included in the S&P 500 index, it has to satisfy the following criteria

  • The company should be from the U.S, and shares should be highly liquid
  • Market cap > $8 Billion
  • Positive earnings in the recent quarter and positive total earnings in the previous year
The strategy is as simple as it gets. The index committee meets every quarter, reviews the companies on the existing list, and sees if there are any new companies that can replace the existing ones using the above 3 rules. That’s how Tesla entered the S&P 500 by replacing Apartment Investment and Management Co in December ’20.
questo bias nella costruzione degli indici pone il risparmiatore/investitore nella condizione di Sisifo. Nonostante tutti i suoi sforzi ed il suo impegno ben difficilmente riuscira' a replicare i rendimenti del mercato e subira' uno scotto monetario per l'uscita di titoli decaduti e l'entrata di titoli emergenti.

Nel modello Stealth bearing market sviluppato da Acampora come ipotesi critica al ben piu' famoso modello EMH di Fama' il trucco nascosto ("stealth") consiste proprio nel peso, a volte importante nel portafoglio, che hanno i titoli depennati.

Prendiamo il famoso caso di scuola Parmalat, ad esempio, che e' finito in tutti i manuali di finanza aziendale per l'inettitudine degli investitori professionali nel prevenire l'impatto della scolorina in aggiuta all'uso sapiente della Olivetti Lettera 32.

Se l'investitore vede fallire le sue Parmalat in portafoglio subisce una perdita effettiva.

L'indice di mercato non subira' questa perdita: le Parmalat verranno fotografate a 0,11, (un numero che e' rimasto nella memoria collettiva l'ultimo giorno di contrattazione) verra ricalcolato il paniere rettificandolo per la capitalizzazione Parmalat e verra' fatto entrare il titolo successivo con la "sua" capitalizzazione di mercato.

Per quanto riguardo l'entrata di titoli emergenti come Tesla, a cui accennavi, spesso buona parte del percorso positivo viene compiuto in prossimita' dell'inclusione negli indici, non dopo. Infatti gli analisti quantitativi professionisti, a differenza dei gestori e degli investitori, sono in grado di attribuire le corrette probabilita' per l'entrata negli indici e ad anticipare il timing di acquisto. Il momento formale in cui questi titoli entrano negli indici, e costringono di fatto gli ETF ad acquistarli, e' spesso un'ottima opportunita' per realizzare gli utili da parte di questi agenti di mercato cosi' "smart".
 
Ultima modifica:
Indietro