Leite
Nuovo Utente
- Registrato
- 16/9/06
- Messaggi
- 3.169
- Punti reazioni
- 197
Will Stock Buybacks Bite Back?
Companies tend to buy their shares in the greatest quantities at the
worst possible time.
By
JASON ZWEIG
As the bull market soars ever higher, investors face big competition
for buying the shares of companies--and it comes from the companies
themselves.
Last year, the corporations in the Russell 3000, a broad U.S. stock
index, repurchased $567.6 billion worth of their own shares--a 21%
increase over 2012, calculates Rob Leiphart, an analyst at Birinyi
Associates, a research firm in Westport, Conn. That brings total
buybacks since the beginning of 2005 to $4.21 trillion--or nearly
one-fifth of the total value of all U.S. stocks today.
There has been a lot of talk in the past few years about how index
funds, which buy and hold stocks regardless of whether they are cheap
or expensive, might be contributing to an overvaluation of the U.S.
stock market. But the companies that make up the U.S. stock market
might be contributing even more. And, if you wanted a signal of when
to get in and out of the market, doing the opposite of whatever
companies themselves are doing would serve you pretty well.
The Russell 3000 returned 33.5% last year, including dividends. At the
end of 2012, the stocks in the index were trading at an average of
16.7 times their net earnings; by year-end 2013, the index was at a
multiple of 20.6 times.
So, even as stock prices rose by a third and became a quarter more
expensive relative to underlying profits, companies bought their own
shares back more aggressively than the year before.
To be sure, corporations should favor a buyback when shares are
trading below the total value of their future cash flows and when
capital expenditures or acquisitions don't appear likely to offer a
higher rate of return. And investors ought to welcome a repurchase,
since it should increase earnings per share--so long as the company
isn't overvalued and can finance the buyback cheaply.
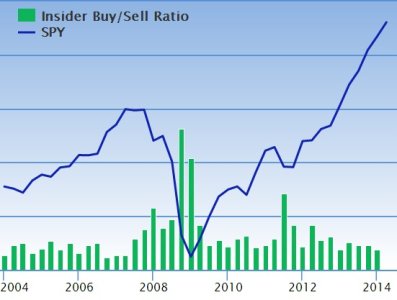
Yet companies tend to exhibit the same perverse timing--buying high and
selling low--as individual and institutional investors. As the market
hit a then-record high in the third quarter of 2007, corporations
bought back more than twice as much of their shares--$214.3 billion
worth--as they did in the depths of the bear market. In the final
quarter of 2008 and first quarter of 2009 combined, repurchases
totaled only $97.3 billion.
"At the bottom, everybody sits on their hands," says Michael
Mauboussin, head of global financial strategies at Credit Suisse.
"They don't do anything when stocks appear to be cheap. But when
stocks are expensive, then they buy back shares hand over fist." The
managers of companies might sometimes seek to offset the issuance of
new shares when stock options are exercised; often, they are subject
to the same fear and greed as anyone else.
Some companies, though, seem to have learned from the financial
crisis. From the first quarter of 2005 through the end of 2006,
between 8% and 12% of all buybacks were made by companies whose shares
were the most expensive, says Mr. Leiphart of Birinyi. Last year,
however, the companies whose shares were the most richly priced
repurchased them at only half the pace of 2005 and 2006.
Moreover, it appears that buybacks aren't about to revisit the peaks
of 2007. So far this year, all U.S. companies have bought back a total
of $15.4 billion, according to Birinyi--about the same level as this
time last year, implying that 2014's pace will roughly match that of
2013.
And last year's total was well below the all-time high of $728.9
billion in 2007, when banks binged on buying back their own shares
right before they collapsed in the financial crisis.
"Over the past couple of years, the thinking has been that once people
got secure with the market, they'd open the coffers and spend
willy-nilly to buy back shares and we'd return to the levels of 2007,"
Mr. Leiphart says. "But companies haven't opened the floodgates like
that."
It is possible, Mr. Mauboussin says, that "maybe they're painted into
a corner and that's all they have to do." If the prospects for the
growth of a business look dim, managers might not want to shell out
for capital expenditures or research and development that won't pay
off for years--preferring instead the instant gratification of buying
back stock.
Taken to extremes, that wouldn't be healthy. In 1924, the pioneering
investment theorist Edgar Lawrence Smith pointed out in his book
"Common Stocks as Long Term Investments" that the ability of companies
to plow earnings back into developing the future growth of their
businesses is "a practical demonstration of the principle of compound
interest."
If share repurchases consume too much of companies' excess profits,
the underlying businesses might end up starved, which could lower
future returns.
So the surge in buybacks is worth watching closely. If companies end
up chasing their own shares as high as they did in 2007, a fall to
earth might not be far behind.
intelligentinvestor@wsj.com; twitter.com/jasonzweigwsj
Companies tend to buy their shares in the greatest quantities at the
worst possible time.
By
JASON ZWEIG
As the bull market soars ever higher, investors face big competition
for buying the shares of companies--and it comes from the companies
themselves.
Last year, the corporations in the Russell 3000, a broad U.S. stock
index, repurchased $567.6 billion worth of their own shares--a 21%
increase over 2012, calculates Rob Leiphart, an analyst at Birinyi
Associates, a research firm in Westport, Conn. That brings total
buybacks since the beginning of 2005 to $4.21 trillion--or nearly
one-fifth of the total value of all U.S. stocks today.
There has been a lot of talk in the past few years about how index
funds, which buy and hold stocks regardless of whether they are cheap
or expensive, might be contributing to an overvaluation of the U.S.
stock market. But the companies that make up the U.S. stock market
might be contributing even more. And, if you wanted a signal of when
to get in and out of the market, doing the opposite of whatever
companies themselves are doing would serve you pretty well.
The Russell 3000 returned 33.5% last year, including dividends. At the
end of 2012, the stocks in the index were trading at an average of
16.7 times their net earnings; by year-end 2013, the index was at a
multiple of 20.6 times.
So, even as stock prices rose by a third and became a quarter more
expensive relative to underlying profits, companies bought their own
shares back more aggressively than the year before.
To be sure, corporations should favor a buyback when shares are
trading below the total value of their future cash flows and when
capital expenditures or acquisitions don't appear likely to offer a
higher rate of return. And investors ought to welcome a repurchase,
since it should increase earnings per share--so long as the company
isn't overvalued and can finance the buyback cheaply.
Yet companies tend to exhibit the same perverse timing--buying high and
selling low--as individual and institutional investors. As the market
hit a then-record high in the third quarter of 2007, corporations
bought back more than twice as much of their shares--$214.3 billion
worth--as they did in the depths of the bear market. In the final
quarter of 2008 and first quarter of 2009 combined, repurchases
totaled only $97.3 billion.
"At the bottom, everybody sits on their hands," says Michael
Mauboussin, head of global financial strategies at Credit Suisse.
"They don't do anything when stocks appear to be cheap. But when
stocks are expensive, then they buy back shares hand over fist." The
managers of companies might sometimes seek to offset the issuance of
new shares when stock options are exercised; often, they are subject
to the same fear and greed as anyone else.
Some companies, though, seem to have learned from the financial
crisis. From the first quarter of 2005 through the end of 2006,
between 8% and 12% of all buybacks were made by companies whose shares
were the most expensive, says Mr. Leiphart of Birinyi. Last year,
however, the companies whose shares were the most richly priced
repurchased them at only half the pace of 2005 and 2006.
Moreover, it appears that buybacks aren't about to revisit the peaks
of 2007. So far this year, all U.S. companies have bought back a total
of $15.4 billion, according to Birinyi--about the same level as this
time last year, implying that 2014's pace will roughly match that of
2013.
And last year's total was well below the all-time high of $728.9
billion in 2007, when banks binged on buying back their own shares
right before they collapsed in the financial crisis.
"Over the past couple of years, the thinking has been that once people
got secure with the market, they'd open the coffers and spend
willy-nilly to buy back shares and we'd return to the levels of 2007,"
Mr. Leiphart says. "But companies haven't opened the floodgates like
that."
It is possible, Mr. Mauboussin says, that "maybe they're painted into
a corner and that's all they have to do." If the prospects for the
growth of a business look dim, managers might not want to shell out
for capital expenditures or research and development that won't pay
off for years--preferring instead the instant gratification of buying
back stock.
Taken to extremes, that wouldn't be healthy. In 1924, the pioneering
investment theorist Edgar Lawrence Smith pointed out in his book
"Common Stocks as Long Term Investments" that the ability of companies
to plow earnings back into developing the future growth of their
businesses is "a practical demonstration of the principle of compound
interest."
If share repurchases consume too much of companies' excess profits,
the underlying businesses might end up starved, which could lower
future returns.
So the surge in buybacks is worth watching closely. If companies end
up chasing their own shares as high as they did in 2007, a fall to
earth might not be far behind.
intelligentinvestor@wsj.com; twitter.com/jasonzweigwsj
")